
Daily Analysis Oil / USD Daily Volatile retracement consolidation
Oil Steadies Near $93 After Sharp Pullback from September Peak
Trendline structure
Volatile retracement consolidation-
Resistance Sept 15 descending resistance
This trendline connects the September 15 peak and the September 18 high, capping the recent pullback and defining the upper boundary of the retracement.
Anchors: 2026-09-15 @ 106.7500 → 2026-09-18 @ 103.4800
-
Support Aug 26 rising support (broken)
This rising support connected the August 26 and September 23 lows and has been decisively broken, signaling the end of the August–September uptrend.
Anchors: 2026-08-26 @ 79.6200 → 2026-09-23 @ 88.7100
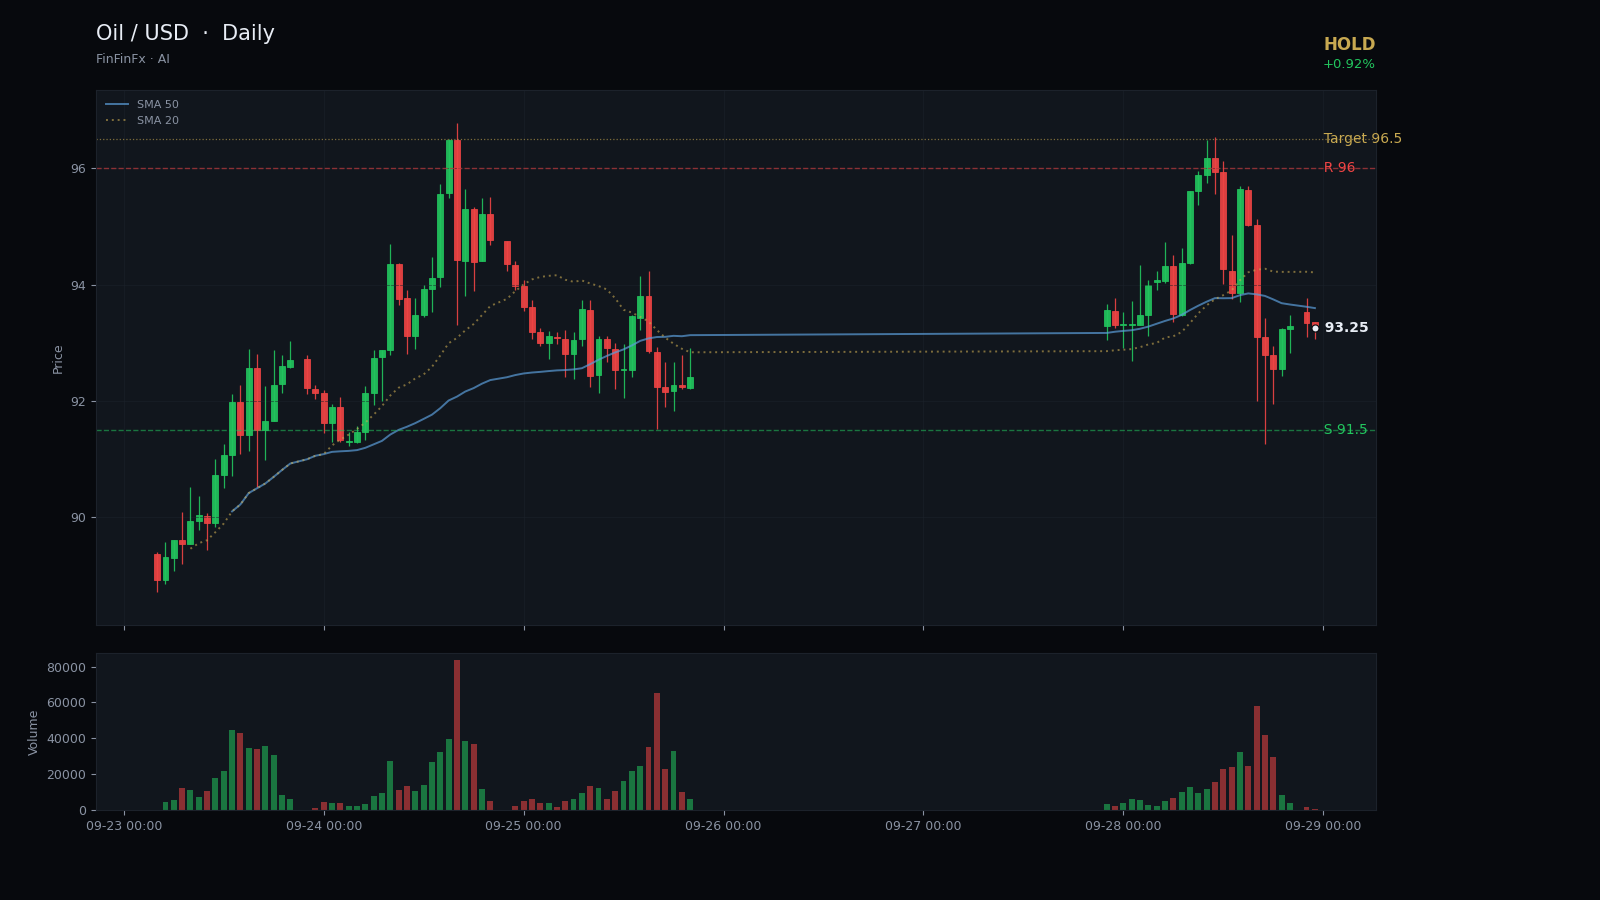
Oil has entered a consolidation phase after a dramatic round-trip that saw prices surge from 84.11 on August 31 to 106.75 on September 15, then collapse 15% over the following eight sessions to close today at 93.26. The rising support trendline connecting the August 26 low at 79.62 and the September 23 low at 88.71 has been decisively broken, signaling that the August–September uptrend is no longer intact. Meanwhile, a resistance trendline drawn from the September 15 peak at 106.75 through the September 18 high at 103.48 continues to cap rallies, forming a broad descending structure that has guided the pullback.
Price is now sandwiched between horizontal support near 91.50—a zone that includes the September 25 intraday low at 91.51 and the September 24 swing low at 91.23—and horizontal resistance at 96.00, defined by the September 9 close and the September 24 high at 96.78. The five-day moving average at 93.41 sits just above the current close, while the twenty-day average at 95.80 remains overhead, confirming that momentum has shifted from bullish to neutral. RSI14 at 50.31 is neither overbought nor oversold, and ATR14 at 4.96 reflects the elevated volatility of the past two weeks.
Given the breakdown of rising support and the lack of a clear directional bias, the prudent stance is to hold and wait for confirmation. A sustained move above 96.00 and reclaim of the SMA20 would reopen the door to a retest of 100–102, with an initial target near 96.50. Conversely, a break below 91.50 would expose the 88.70–89.00 zone and potentially the August range lows. Until one of these thresholds is breached with conviction, the market remains in a volatile retracement consolidation, and traders should avoid chasing either direction without a confirmed breakout or breakdown.
Trade Aug 26 rising support (broken) and more on a real account — open one in minutes.
Open an account