
Daily Analysis EUR / USD Daily Oversold bounce setup
EUR/USD Oversold Bounce Opportunity After Sharp Decline to 1.1373
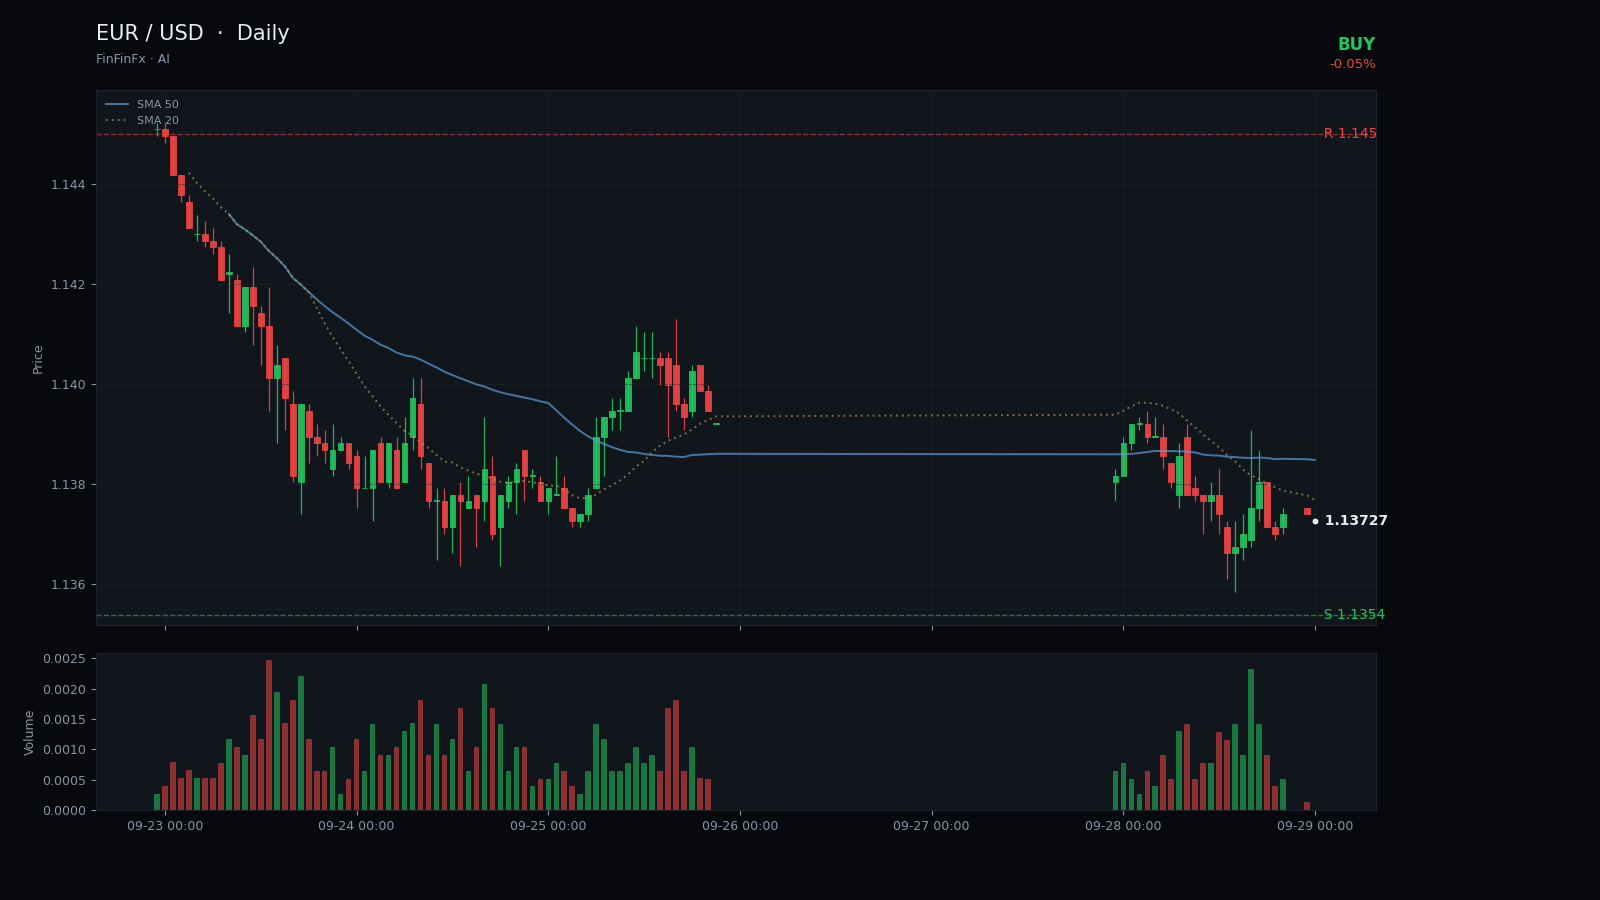
Trendline structure
Oversold bounce setup-
Resistance Aug 20 descending resistance
This falling resistance line has capped every rally since late August, defining the upper boundary of the downtrend channel.
Anchors: 2026-08-20 @ 1.1711 → 2026-09-10 @ 1.1643
-
Support Aug 31 channel support
Parallel support line marking the lower boundary of the descending channel, currently being tested after a sharp decline.
Anchors: 2026-08-31 @ 1.1589 → 2026-09-25 @ 1.1369
EUR/USD has carved out a well-defined descending channel over the past month, with price respecting a falling resistance line that connects the August 20 high at 1.1711 and the September 10 peak at 1.1643. This trendline has capped every rally attempt since late August, guiding the pair lower through a series of lower highs. A parallel support line drawn from the August 31 low at 1.1585 through the September 25 swing low at 1.1369 defines the lower boundary of this channel, and price is now testing that floor after a sharp five-day decline.
The current close at 1.1373 sits just above the 20-day low of 1.1354, which serves as our primary support. The 14-period RSI has collapsed to 6.67, an extreme reading that historically precedes short-term bounces even within established downtrends. ATR at 0.0053 confirms elevated volatility, while the SMA5 at 1.1391 and SMA20 at 1.1522 both slope downward, underscoring the dominant bearish structure. However, the distance between price and both moving averages, combined with the RSI extreme, suggests the selling pressure may be temporarily exhausted.
We see an oversold bounce setup forming. Entry at 1.1373 targets a move back toward the mid-channel zone near 1.1450, which aligns with the September 21–23 consolidation area and represents the first meaningful resistance. A push through that level would open the door to 1.1480, where the descending resistance trendline is projected to intersect. Risk management is critical: a stop-loss at 1.1330 protects against a breakdown below the channel support, which would signal continuation of the larger downtrend rather than a corrective bounce.
This is a counter-trend trade within a clear downtrend, so position sizing should reflect the elevated risk. The call is invalidated if price closes below 1.1330, confirming that sellers remain in full control and that the channel support has failed. Until then, the technical setup favors a short-term rebound toward 1.1450–1.1480.
Trade Aug 31 channel support and more on a real account — open one in minutes.
Open an account