
Daily Analysis Oil / USD Daily Volatile consolidation after spike
Oil Consolidates Near $93 After Sharp Reversal From September Highs
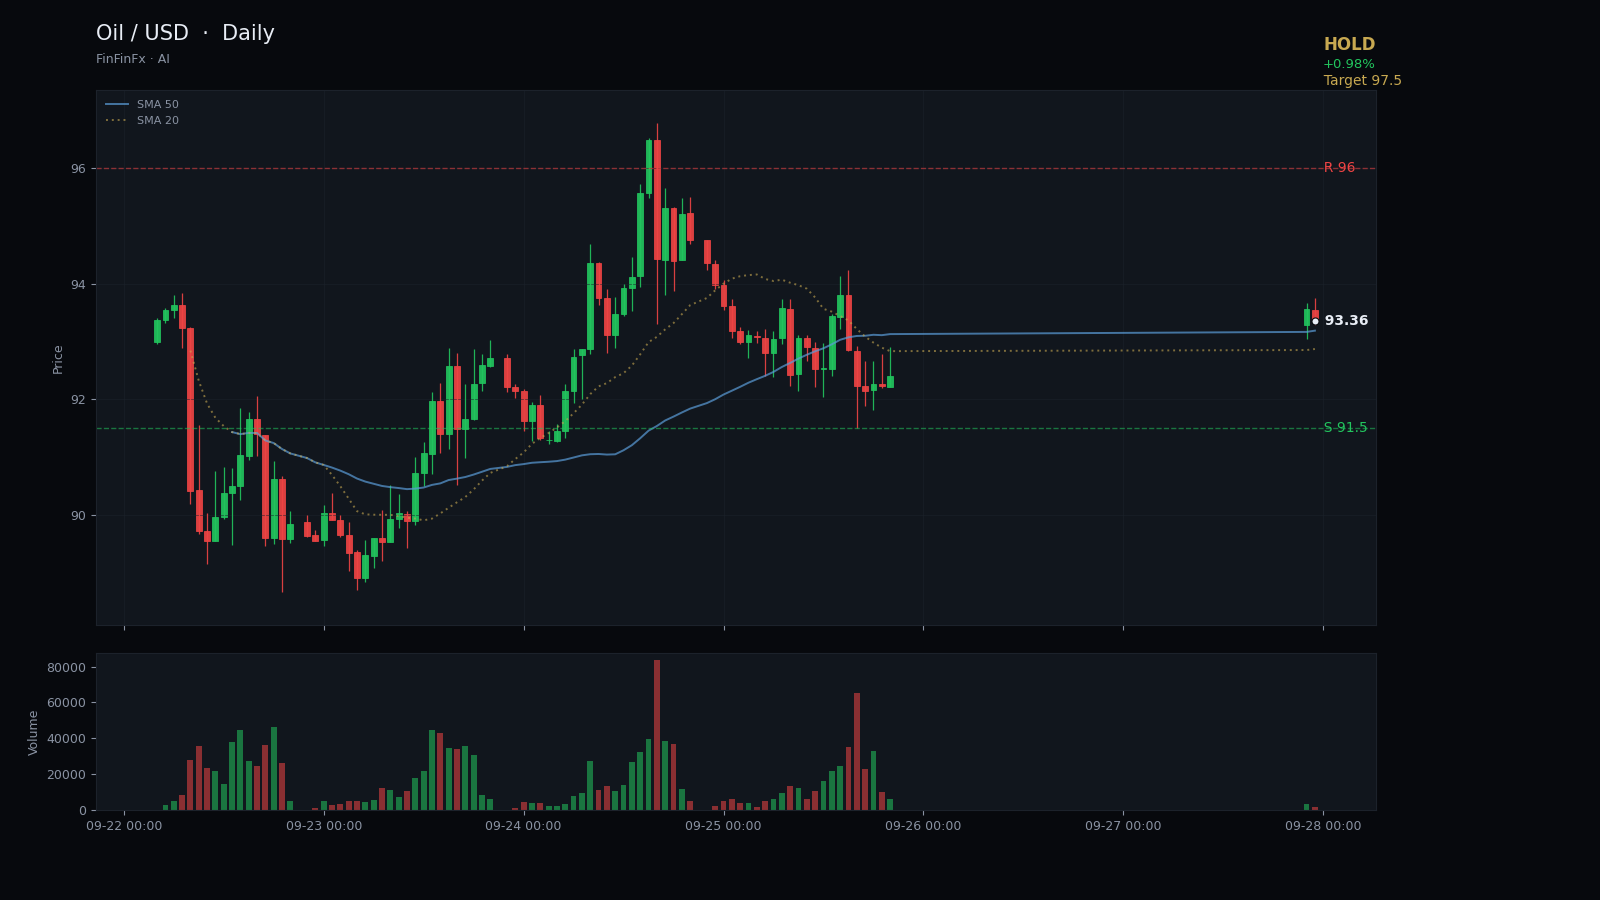
Trendline structure
Volatile consolidation after spike-
Support Broken Aug rising support
This rising support line from late August was violated on September 21, ending the prior uptrend structure.
Anchors: 2026-08-26 @ 79.6200 → 2026-08-31 @ 84.1100
-
Resistance Sep spike high resistance
This line connects the September rally highs and marks the upper boundary of the recent volatile spike.
Anchors: 2026-09-09 @ 96.9300 → 2026-09-15 @ 106.7500
Oil has entered a consolidation phase after one of the most volatile sequences in recent months. Between September 10 and September 15, price spiked from $96 to a 20-day high of $106.75, only to reverse sharply and surrender the entire gain within six sessions. The market now trades at $93.32, just above the five-day moving average of $93.42 but still 2.6% below the twenty-day average at $95.81. This positioning reflects uncertainty rather than conviction.
The chart reveals a broken uptrend. A rising support line connecting the August 26 low at $79.62 and the August 31 pivot at $84.11 was decisively violated on September 21 when price collapsed from $101 to $95.78 in a single session. That breakdown erased the structural foundation of the prior rally. Since then, oil has oscillated in a $91.50–$96.00 band, with neither bulls nor bears able to establish control. The RSI at 50.39 sits precisely at the midpoint, confirming the lack of directional momentum. ATR remains elevated at 4.96, a reminder that while the trend is unclear, intraday swings remain wide.
Immediate resistance stands at $96.00, the September 9 close and the upper boundary of recent chop. A sustained break above that level would reopen the door to $100 and potentially challenge the September highs. On the downside, support rests at $91.50, the September 25 intraday low. A close below that threshold would likely trigger a retest of the August lows near $84. Given the current setup—a volatile consolidation after spike pattern with no clear directional bias—the prudent stance is to hold and wait for a breakout or breakdown with volume confirmation.
Risk management is critical in this environment. A stop-loss at $89.80 protects against a deeper retracement toward the August range. The target of $97.50 assumes a successful retest of resistance and a resumption of the September rally. However, this call is invalidated if price closes below $89.80 or if the consolidation extends beyond two more sessions without a decisive move. In that case, the market may require a deeper correction before the next tradable trend emerges.
Trade Sep spike high resistance and more on a real account — open one in minutes.
Open an account