
Daily Analysis Oil / USD Daily Breakdown from rising wedge
USOIL Falls 2.3% After Wedge Breakdown – Consolidation or Further Decline Ahead
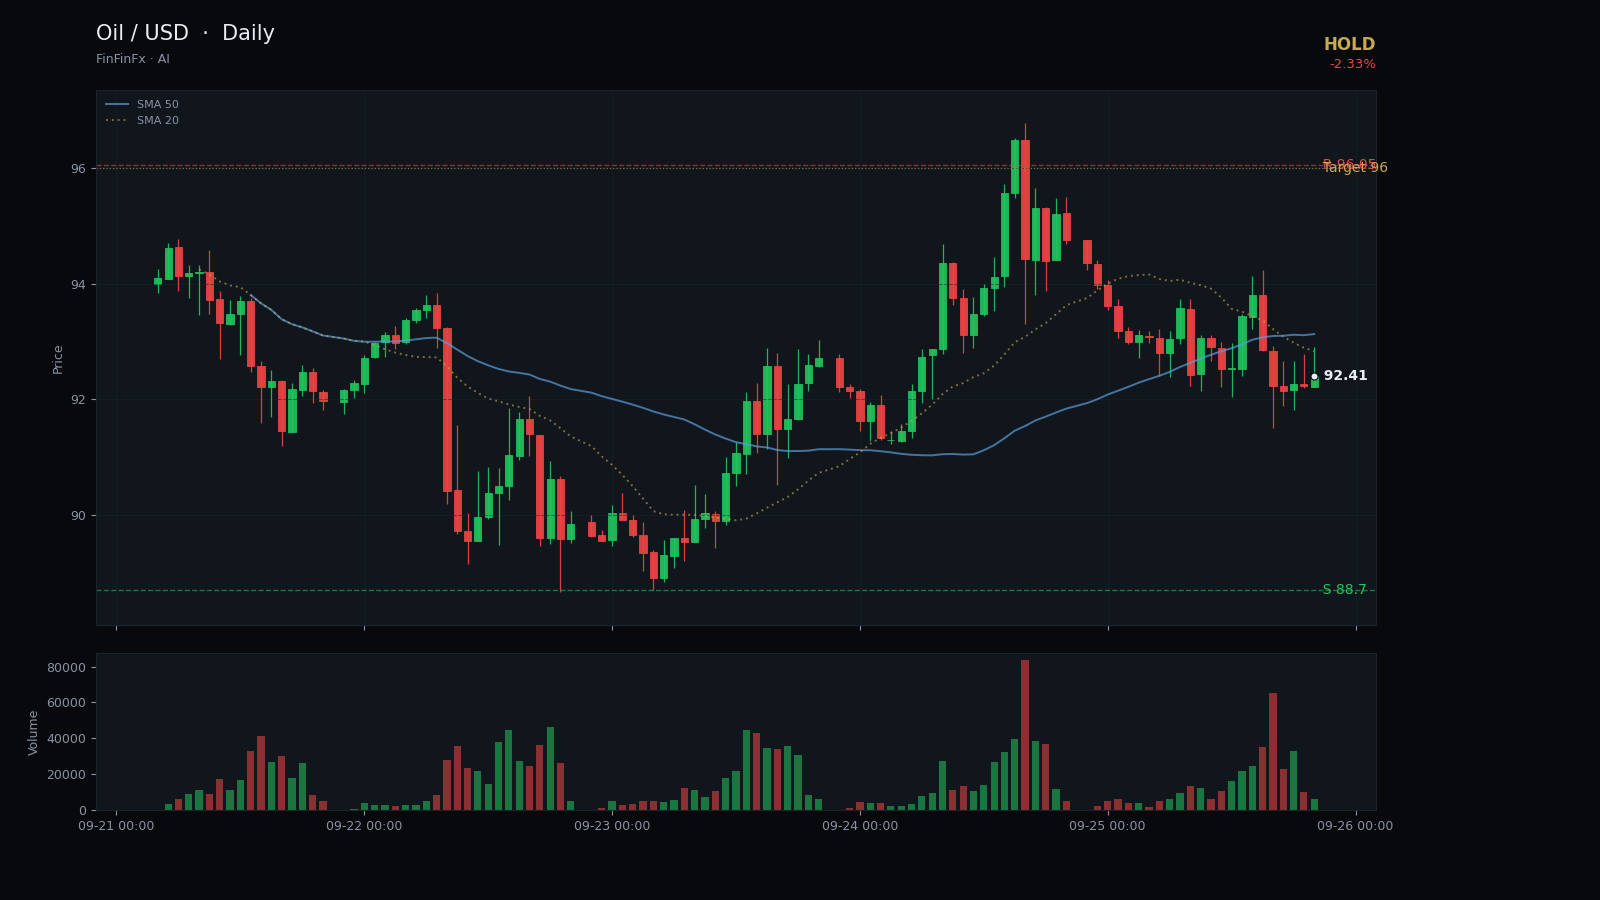
Trendline structure
Breakdown from rising wedge-
Support Rising wedge support (broken)
This ascending support line connected the August 28 and September 8 lows and was broken yesterday, signaling potential trend exhaustion.
Anchors: 2026-08-28 @ 82.2500 → 2026-09-08 @ 90.8700
-
Resistance Rising wedge resistance
This upper boundary capped the rally at the September 11 and September 15 peaks, completing the wedge pattern before the breakdown.
Anchors: 2026-09-11 @ 104.4600 → 2026-09-15 @ 106.7500
Oil has spent the past three weeks carving out a rising wedge pattern that began with the 82.25 low on August 28 and culminated in the 106.75 high on September 15. The lower boundary of this wedge, drawn through the August 28 and September 8 swing lows, provided reliable support as price climbed steadily higher. The upper boundary, connecting the September 11 and September 15 peaks, capped the rally and marked the point of exhaustion. This wedge structure is now broken; yesterday's close at 92.41 represents a decisive move below the rising support line, accompanied by a 2.33 percent decline and a close beneath both the 5-day and 20-day moving averages.
Key horizontal levels frame the current environment. Immediate resistance sits at 96.05, the September 9 high and the point where sellers have recently re-engaged. A move back above this level would suggest the breakdown was a false signal and reopen the door to a retest of the 100–102 zone. On the downside, support is found at 88.70, the September 4 intraday low, which also aligns with the lower edge of the recent consolidation band. A break below 88.70 would confirm bearish continuation and target the 82–85 area where the August lows reside. The RSI at 51 is neutral, offering no directional conviction, while the ATR of 5.14 reflects elevated volatility that has persisted through the wedge formation and breakdown.
Given the breakdown from the rising wedge and the current position below both moving averages, the prudent stance is to hold and await confirmation. A long entry near 92.41 carries risk without a clear bullish reversal signal, while a short position lacks confirmation below 88.70 support. Traders should watch for a decisive close below 88.70 to validate bearish continuation, or a reclaim of 96.05 to signal a failed breakdown and potential reversal. Until one of these thresholds is breached, the market remains in a state of flux. A stop loss at 86.50 protects against a deeper collapse, while a target near 96.00 offers a reasonable reward if the breakdown proves false and buyers return.
Trade Rising wedge resistance and more on a real account — open one in minutes.
Open an account