
Daily Analysis EUR / USD Daily Oversold bounce setup
EUR/USD Oversold Bounce Setup After Sharp Decline to 1.1401
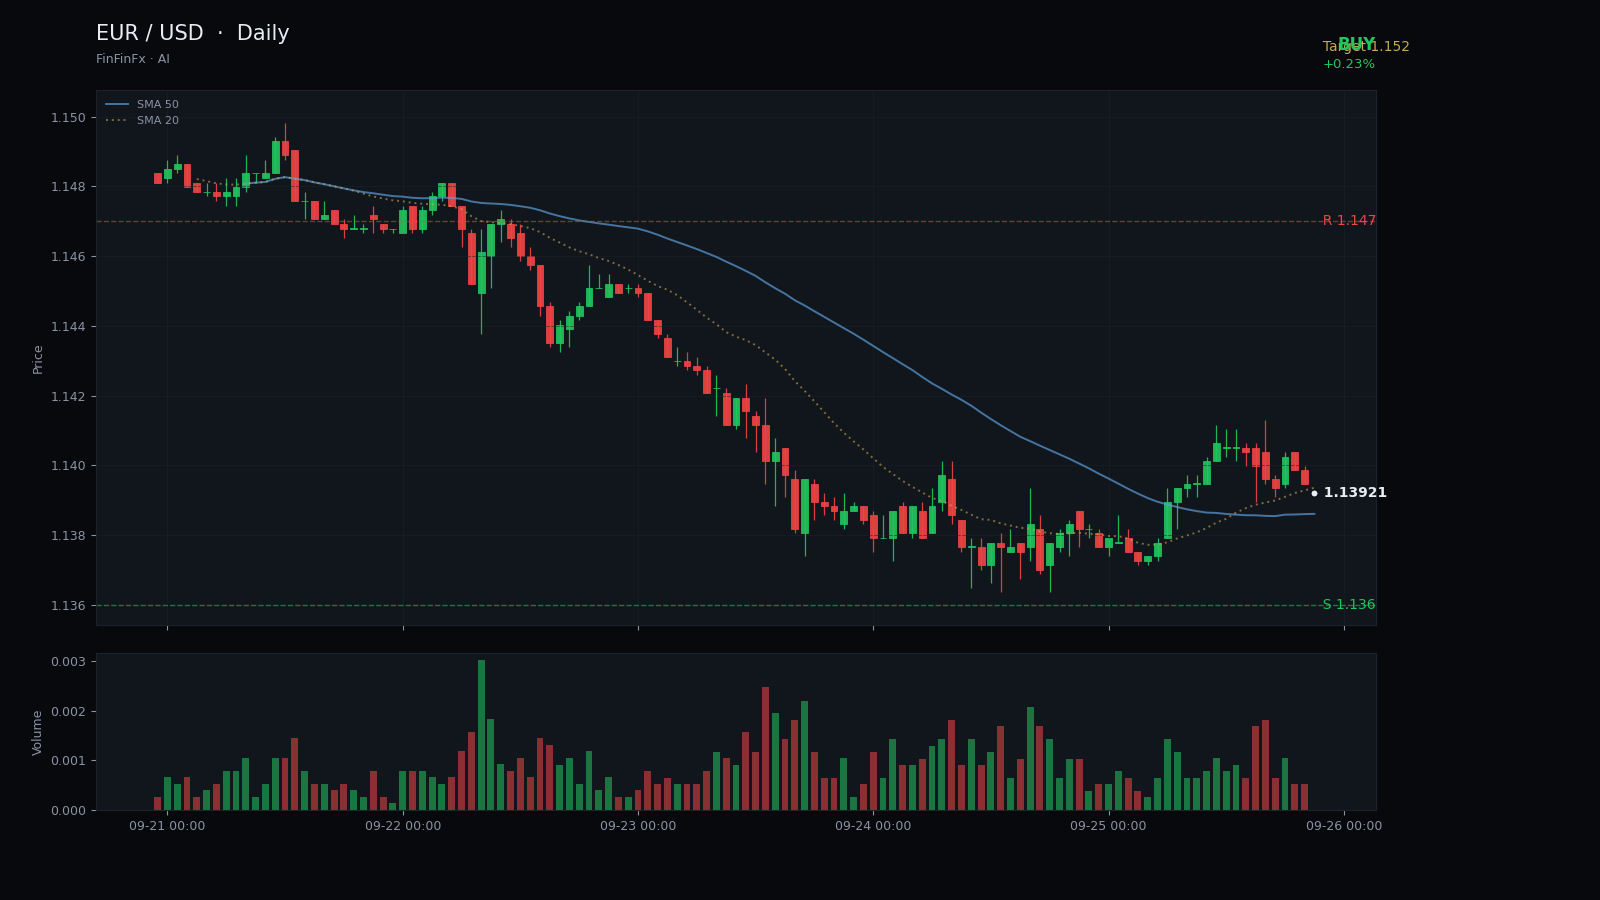
Trendline structure
Oversold bounce setup-
Resistance Aug 19 descending resistance
This trendline connects the August 19 and September 4 swing highs, defining the upper boundary of the month-long descending channel.
Anchors: 2026-08-19 @ 1.1678 → 2026-09-04 @ 1.1633
-
Support Sep 24 channel support
This support line runs through the September 24 and 26 lows, forming the lower boundary of the descending channel and marking immediate support.
Anchors: 2026-09-24 @ 1.1360 → 2026-09-26 @ 1.1399
EUR/USD has endured a punishing decline over the past month, falling from the 1.1654 high on August 19 to the current 1.1401 close on September 26. The pair has shed more than 250 pips in a near-linear descent, carving out a steep descending channel that now defines the technical structure. The upper boundary of this channel connects the August 19 and September 4 swing highs, while the lower boundary runs through the September 24 and September 26 lows. Price has respected both boundaries with precision, and the current close sits just above the lower support line, suggesting the downtrend remains intact but may be reaching a short-term exhaustion point.
The 14-period RSI has plunged to 13.7, the most extreme oversold reading in the visible dataset. Historically, RSI levels below 20 often precede at least a tactical bounce, even within a dominant downtrend. The 20-day low at 1.1360 marks the immediate floor, tested twice in the past three sessions, and this level now serves as primary support. Resistance is layered: the first meaningful obstacle lies at 1.1470, the September 21 swing high, followed by the psychologically important 1.1520 zone near the mid-September consolidation. The five-day SMA at 1.1414 sits just above current price, while the 20-day SMA at 1.1536 remains far overhead, confirming the bearish trend bias.
Given the oversold bounce setup, a cautious buy is warranted for traders willing to fade the extreme. Entry at 1.1401 targets a move toward 1.1470 initially, with extension potential to 1.1520 if momentum builds. A stop-loss at 1.1330—roughly 70 pips below current price and beneath the 20-day low—protects against a continuation breakdown. The ATR of 0.0054 (54 pips) suggests recent volatility supports this range. This is a counter-trend trade; invalidation occurs if price closes below 1.1330, signaling the downtrend has resumed without relief. Any bounce should be treated as a correction within the larger bearish structure unless price reclaims 1.1550 and holds.
Trade Sep 24 channel support and more on a real account — open one in minutes.
Open an account