
Daily Analysis Bitcoin / USD Daily High-level consolidation
Bitcoin Consolidates Near Highs After Sharp Rally, Cautious Hold Advised
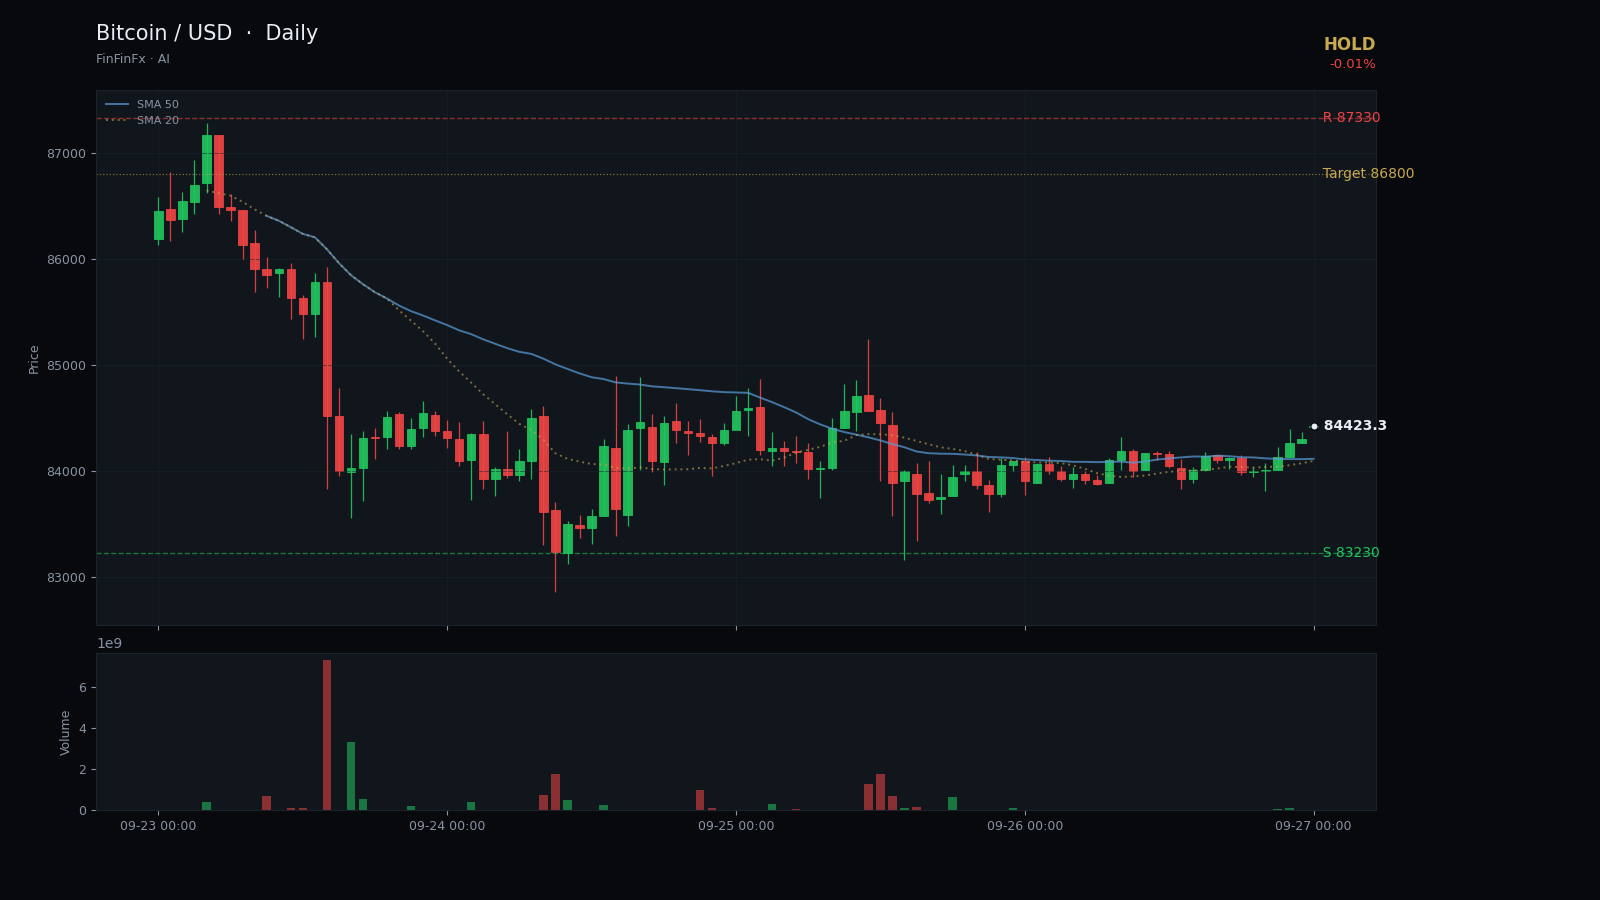
Trendline structure
High-level consolidation-
Support Sep 16 rising support
This trendline connects the September 16 and 24 lows and has defined the lower boundary of the recent rally.
Anchors: 2026-09-16 @ 75,151.00 → 2026-09-24 @ 82,941.00
Bitcoin has entered a high-level consolidation phase after a powerful rally that carried price from the mid-75K region to a 20-day high of 87,330 on September 22. The most important structural feature on the chart is the rising support trendline connecting the September 16 low at 75,151 and the September 24 low at 82,941. This line has defined the lower boundary of the advance and currently projects near 83,200, closely aligned with yesterday's intraday low of 83,230. The trendline is only ten days old but has been respected on every pullback during the rally, giving it meaningful weight.
Price closed today at 84,001, virtually unchanged from yesterday and sitting comfortably above both the 5-day SMA at 84,619 and the 20-day SMA at 80,285. The 20-day range spans from 75,038 to 87,330, and current price action is unfolding in the upper third of that range. Immediate resistance remains the September 22 high at 87,330, while primary support is the rising trendline and the horizontal zone around 83,230. The RSI14 reading of 68.92 indicates momentum remains firm but is approaching overbought territory, suggesting limited room for an impulsive move higher without a period of digestion or a shallow pullback.
The pattern here is a high-level consolidation following a sharp vertical move. The five-day range has tightened considerably—yesterday's bar showed a narrow 2,666-point range compared to the 6,207-point range on September 21—and the ATR14 of 2,489 reflects elevated but stabilising volatility. This compression often precedes a directional break, but the current setup does not yet offer a high-probability entry. A breakout above 87,330 on expanding volume would confirm continuation and open the door toward 88,500–89,000. Conversely, a daily close below the rising support trendline near 83,200 would signal that the rally has stalled and increase the risk of a deeper retracement toward the 20-day SMA at 80,285.
Given the elevated RSI, the lack of a clear breakout, and the proximity to recent highs, the prudent stance is to hold existing positions rather than chase price at current levels. New long entries are better reserved for either a successful breakout above 87,330 or a pullback that holds the 83,200–83,600 support zone with a bullish reversal signal. The call is invalidated if price closes below 82,500, which would break both the rising trendline and the recent consolidation base, shifting the near-term bias to neutral or bearish.
Trade Sep 16 rising support and more on a real account — open one in minutes.
Open an account