
Daily Analysis Gold / USD Daily Falling wedge compression
Gold Tests Wedge Support Near 4320 – Oversold Bounce Setup Emerges
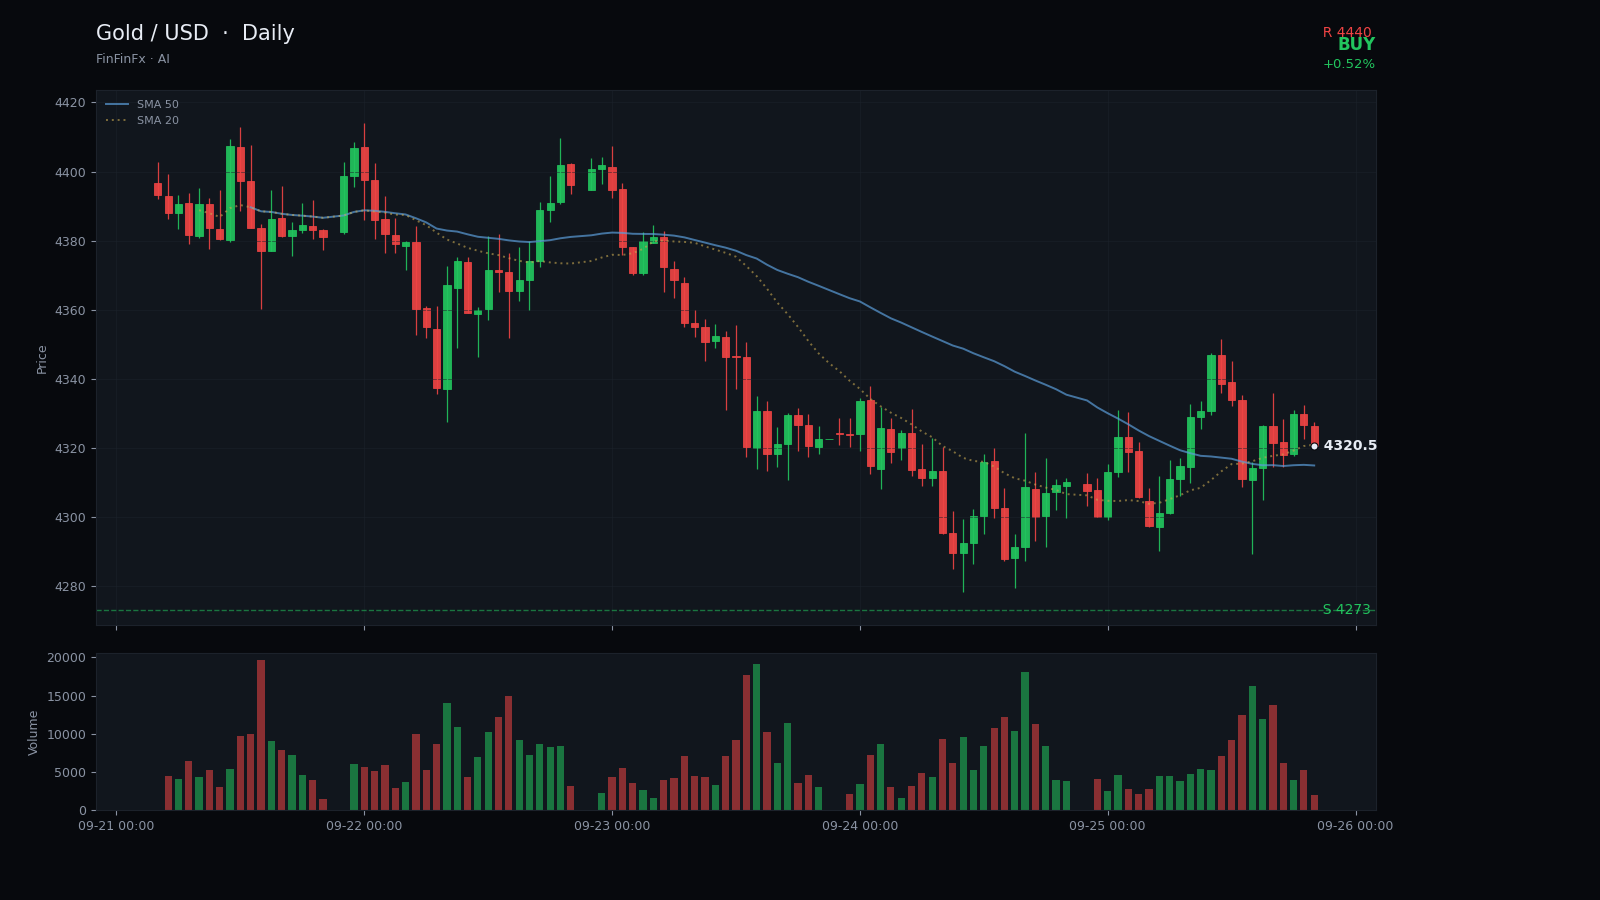
Trendline structure
Falling wedge compression-
Resistance Aug 24 descending resistance
This trendline connects the August peak with the mid-September high, capping every rally attempt and defining the upper boundary of the falling wedge.
Anchors: 2026-08-24 @ 4,738.00 → 2026-09-18 @ 4,440.00
-
Support Sep 16 rising wedge support
This support line links the September low with recent lows, forming the lower boundary of the wedge and currently being tested.
Anchors: 2026-09-16 @ 4,273.00 → 2026-09-24 @ 4,278.00
Gold has carved out a falling wedge over the past three weeks, defined by a descending resistance line connecting the 24 August high at 4738 and the 18 September peak at 4440, and a parallel support trendline linking the 16 September low at 4273 with today's test near 4290. Both boundaries are converging, compressing volatility and signaling that a directional break may be imminent. The wedge structure has been respected cleanly: each rally into the upper boundary since late August has been rejected, while dips toward the lower rail have found buyers. This symmetry gives the pattern credibility.
Price closed today at 4320, just above the lower wedge support around 4273–4290. The 20-day range spans 4688 down to 4273, and we are now trading in the bottom quartile of that range. RSI14 sits at 32, firmly in oversold territory and the lowest reading in this dataset, while the five-day moving average at 4339 has crossed below the 20-day at 4407—a bearish crossover that reflects the recent downtrend. However, wedges are typically continuation patterns in downtrends but reversal patterns when they appear after extended declines; given the 15% drop from the August peak and the oversold momentum, a bullish resolution is plausible.
Key horizontal resistance now sits at 4440, the September high and the upper wedge boundary. A daily close above that level would confirm a wedge breakout and open the door toward 4485–4500, where the 20-day SMA and prior consolidation zones reside. Immediate support is 4273, the 20-day low and the lower wedge rail; a break below 4250 would invalidate the wedge thesis and likely trigger another leg lower toward 4200. ATR14 at 94 points suggests any breakout move could be swift.
The call is a cautious buy from current levels near 4320, targeting 4485 on a wedge breakout above 4440. Stop-loss is placed at 4250 to limit downside if support fails. This setup hinges on the wedge holding and RSI beginning to recover. If price closes below 4250 or fails to reclaim 4340 within the next few sessions, the bullish case weakens and a hold or exit is warranted.
Trade Sep 16 rising wedge support and more on a real account — open one in minutes.
Open an account