
Daily Analysis Oil / USD Daily Failed breakout pullback
Oil Retreats After Failed Breakout Above $106, Consolidation Likely Near $92
Trendline structure
Failed breakout pullback-
Resistance Sep 15 descending resistance
This trendline connects the September 15 spike high at $106.75 with the September 9 peak at $96.93, capping the recent rally and defining the upper boundary of the pullback.
Anchors: 2026-09-15 @ 106.7500 → 2026-09-09 @ 96.9300
-
Support Aug 26 rising support
This rising trendline from the August 26 low at $79.62 through the September 8 swing low at $90.87 has supported the rally and currently projects near $88.70.
Anchors: 2026-08-26 @ 79.6200 → 2026-09-08 @ 90.8700
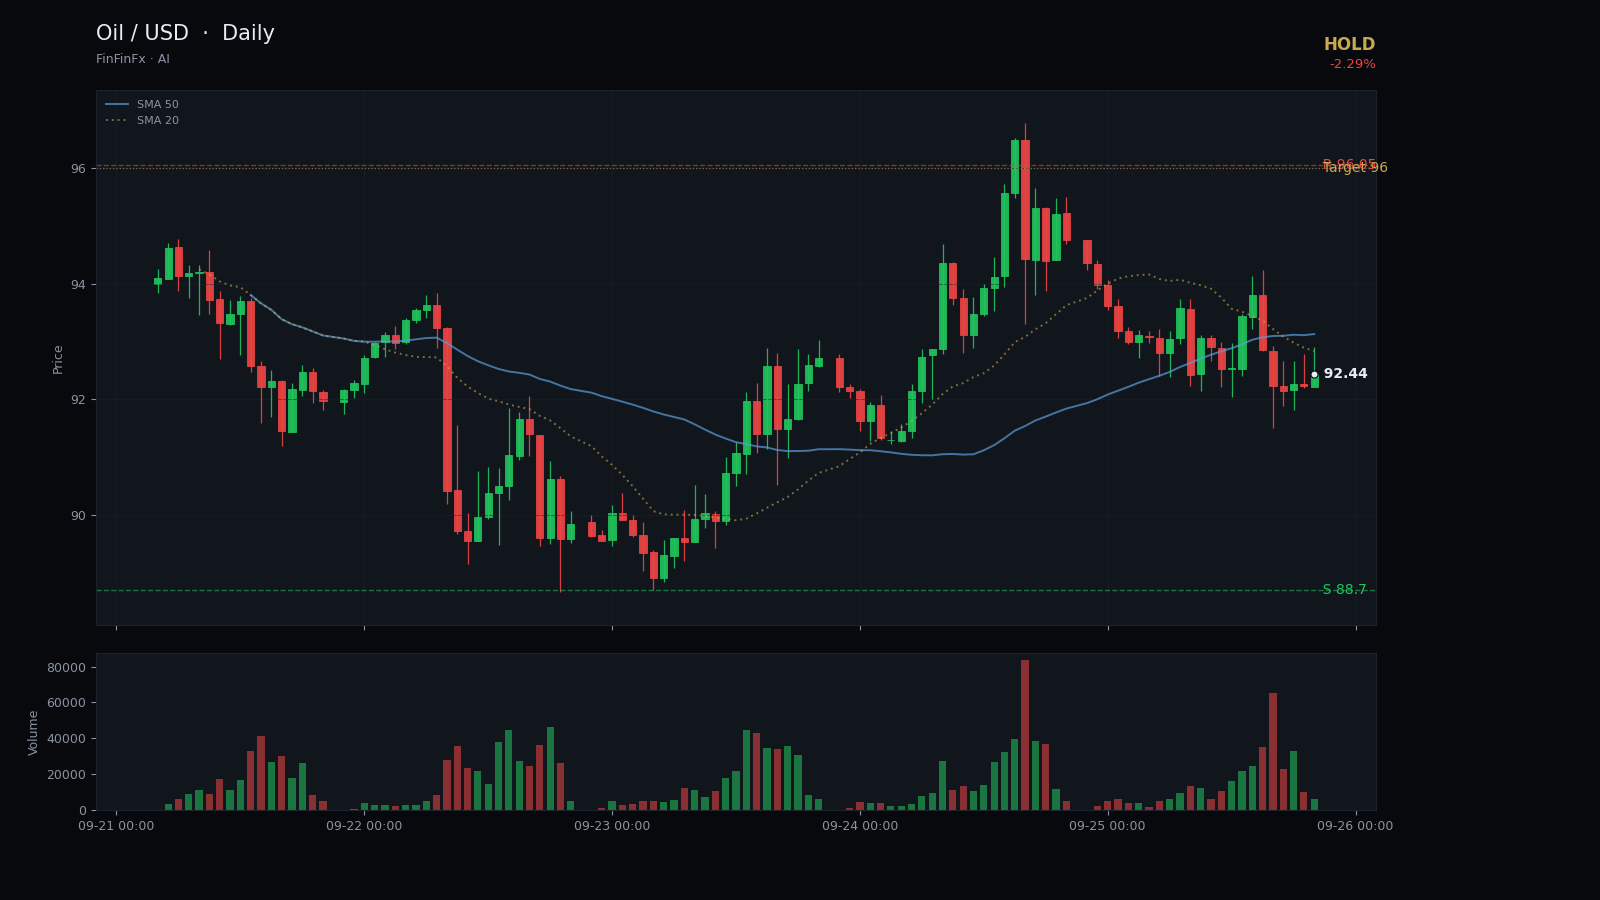
Oil has traced a volatile arc over the past three weeks, climbing from the low-$80s into a sharp spike that touched $106.75 on September 15 before reversing just as quickly. That high now anchors a descending resistance trendline connecting the September 15 peak at $106.75 and the September 9 local high at $96.93. Price has since fallen away from that line, closing today at $92.44—down 2.3 percent on the session—and now sits below both the five-day SMA at $93.92 and the twenty-day SMA at $95.31. The slope of those moving averages is beginning to flatten, signaling that the sharp uptrend from late August has stalled.
On the support side, a rising trendline drawn from the August 26 low at $79.62 through the September 8 swing low at $90.87 has provided a floor during the recent rally. That line currently projects near $88.70, which also corresponds to the September 4 intraday low and serves as our primary support zone. A break below $88.70 would confirm that the bullish momentum has fully unwound and open the door to a retest of the mid-$80s. Resistance overhead is layered: the immediate ceiling sits at $96.05, the September 9 close, while any recovery that reclaims that level would then face the descending trendline from the $106.75 high.
The RSI stands at 51, squarely neutral, and the ATR has expanded to 5.14, reflecting the recent volatility. With price now sandwiched between $88.70 support and $96 resistance, and moving averages converging, the failed breakout pullback pattern suggests Oil is entering a consolidation phase rather than offering a clear directional setup. A hold signal is appropriate here: traders should wait for a decisive break of either boundary before committing. Entry can be considered near current levels only if accompanied by tight risk management; a stop below $86.50 protects against a deeper slide, while a target near $96 offers a modest reward if the range holds. This setup is invalidated if price closes below $86.50 or, conversely, if it reclaims $96 and the descending trendline on strong volume, signaling renewed bullish intent.
Trade Aug 26 rising support and more on a real account — open one in minutes.
Open an account