
Daily Analysis Oil / USD Daily Breakdown from rising channel
Oil / USD Breaks Lower After Sharp Rejection at Channel Resistance
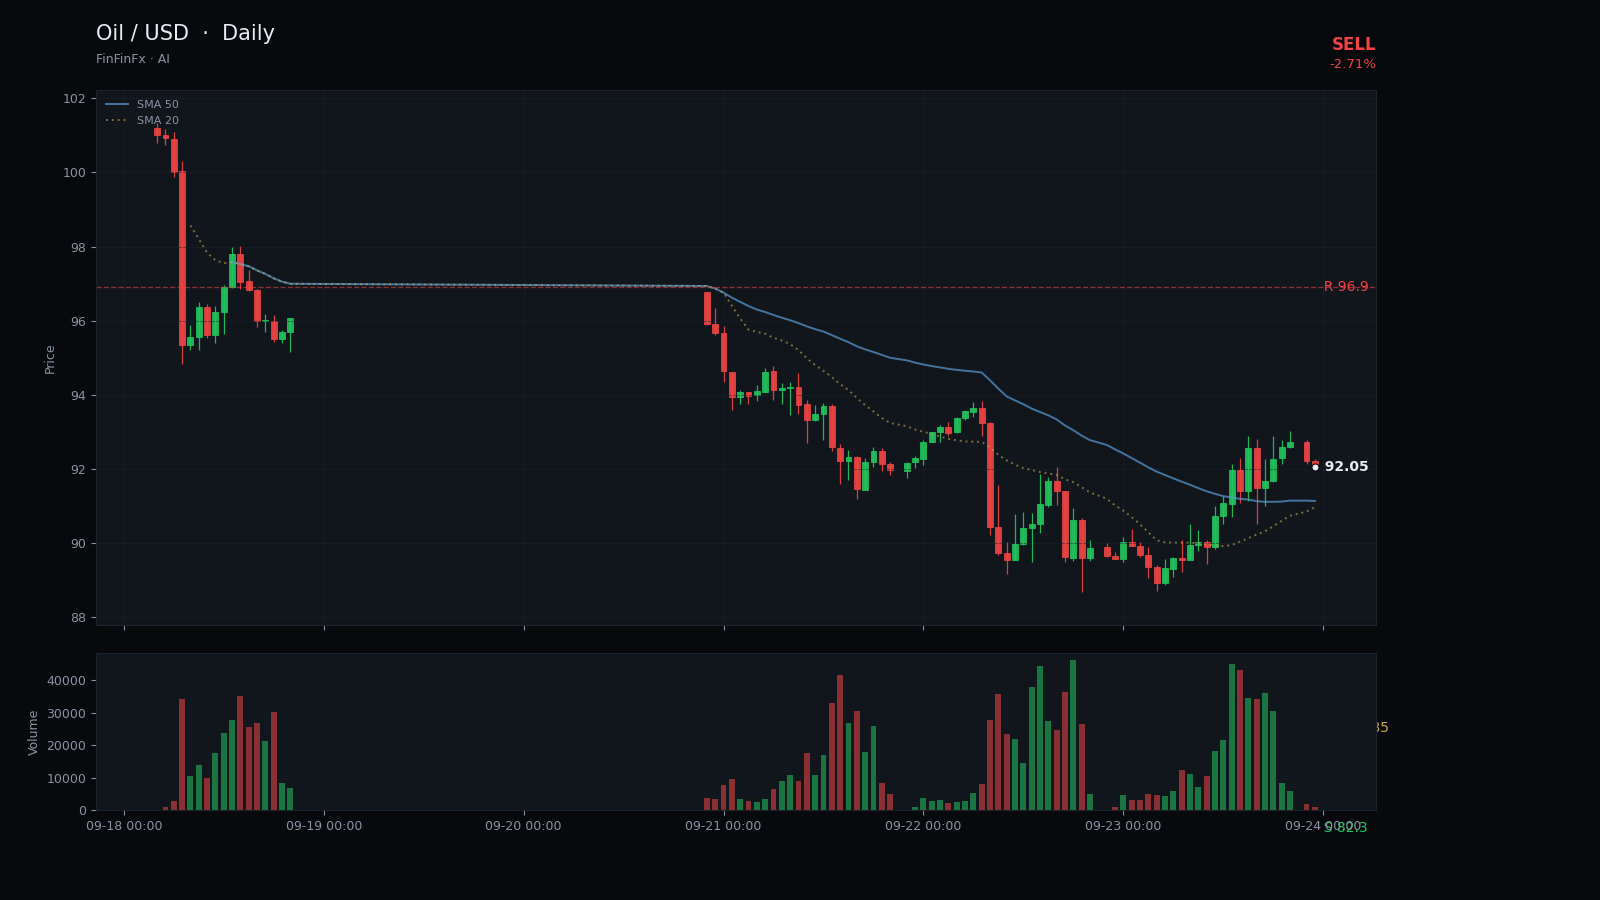
Trendline structure
Breakdown from rising channel-
Support Rising channel support (broken)
This trendline connected the August and September lows, defining the lower boundary of the rising channel until yesterday's breakdown.
Anchors: 2026-08-26 @ 79.6200 → 2026-09-21 @ 94.2200
-
Resistance Rising channel resistance
The upper boundary of the channel that capped the rally at 106.75 and triggered the reversal that led to the breakdown.
Anchors: 2026-08-13 @ 83.3000 → 2026-09-15 @ 106.7500
Oil has broken down from a rising channel that governed price action since late August. The channel's lower boundary connected the 26 August low at 79.62 and the 21 September low at 94.22, forming a well-defined support trendline that held for nearly four weeks. Price respected this structure through multiple tests, most recently on 21 September, before yesterday's decisive break below 92.03 confirmed the breakdown from rising channel pattern.
The upper boundary of this channel, drawn from the 13 August high at 83.30 through the 15 September peak at 106.75, capped the rally and triggered a sharp reversal. That 106.75 high marked a 20-day extreme before sellers overwhelmed the structure. The breakdown has now placed price below both the five-day SMA at 96.92 and the twenty-day SMA at 94.24, with the shorter average rolling over—a technical deterioration that typically precedes further weakness.
Primary resistance now sits at 96.90, the approximate level of the broken channel support turned resistance and the five-day moving average. A retest of this zone would offer a lower-risk entry for bearish continuation trades. Horizontal support lies at 82.30, the consolidation floor from late August that also aligns with the prior range base. The RSI14 at 51.52 has room to fall before reaching oversold territory, while the ATR14 of 4.77 suggests daily swings remain elevated, requiring wider stops.
The sell signal targets 85.00, a level that represents the mid-August consolidation and a logical downside objective given the channel width. Entry is marked at the last close of 92.03, with a stop-loss at 97.50 to allow for minor whipsaw above the broken support. This setup offers a risk-reward ratio near 1:1.3. Invalidation would occur on a daily close back above 97.50, particularly if accompanied by a reclaim of the five-day SMA, which would suggest the breakdown was a false move and the rising channel remains intact.
Trade Rising channel resistance and more on a real account — open one in minutes.
Open an account