
Daily Analysis Gold / USD Daily Descending channel consolidation
Gold Tests Lower Channel Support After Sharp August Decline
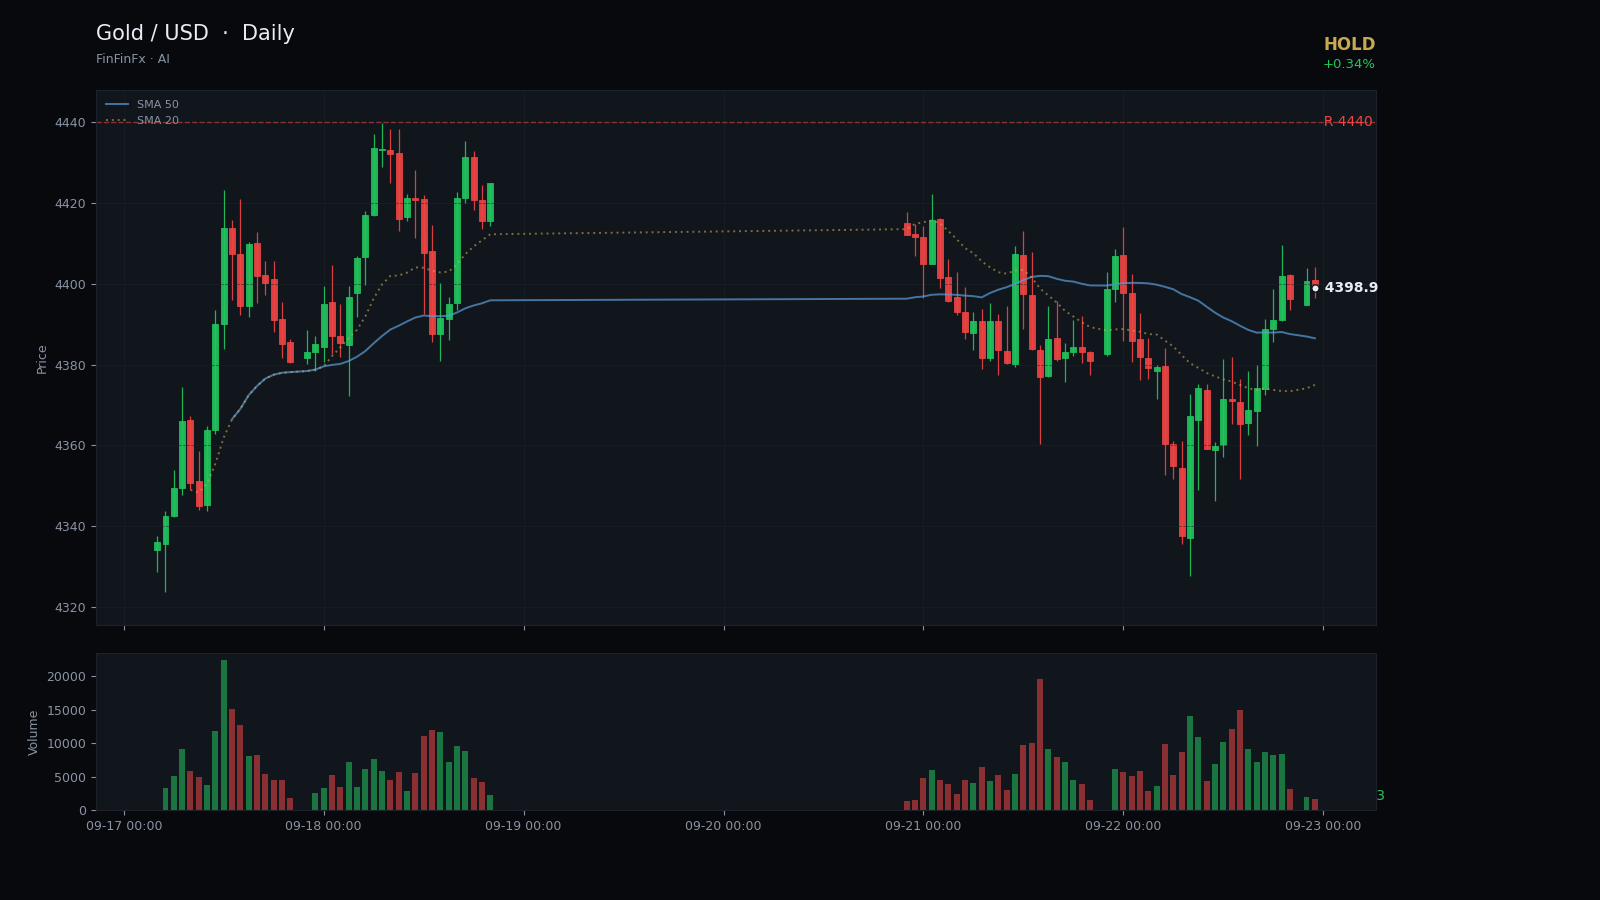
Trendline structure
Descending channel consolidation-
Resistance Aug 25 descending resistance
Upper boundary of the descending channel connecting the August peak with the September 3 swing high, capping all rally attempts.
Anchors: 2026-08-25 @ 4,755.00 → 2026-09-03 @ 4,558.50
-
Support Parallel channel support
Lower boundary running parallel to resistance, tested twice and holding as structural floor for the current downtrend.
Anchors: 2026-08-31 @ 4,445.60 → 2026-09-16 @ 4,273.30
Gold has carved out a clear descending channel since peaking at 4,755 on August 25. The upper boundary connects the August 25 high with the September 3 swing at 4,558, forming a well-defined resistance trendline that has capped every rally attempt over the past three weeks. The lower boundary runs parallel from the August 31 low at 4,445 through the September 16 test at 4,273, providing a structural floor that has been respected twice. This channel, now 23 days old, frames a controlled downtrend rather than a chaotic selloff, suggesting institutional distribution rather than panic.
Price currently sits at 4,398, just above the lower channel support near 4,273 and well below the 20-day SMA at 4,462. The 5-day SMA at 4,399 is converging with price, indicating short-term equilibrium. RSI at 50.21 is perfectly neutral, offering no directional edge, while the ATR of 101 points to continued wide daily swings. Resistance is clearly defined at 4,440, where the channel midpoint and recent consolidation zone intersect. A break above that level would target the upper channel boundary near 4,500–4,520, but we have seen no conviction in recent bounces.
The descending channel consolidation pattern suggests Gold remains under distribution pressure, yet the two successful tests of lower support hint at buying interest emerging near 4,270. Given the neutral RSI, proximity to support, and lack of breakout momentum, a hold stance is prudent. Buyers might consider scaling in only on a decisive close above 4,440 with expanding volume. Conversely, a daily close below 4,273 would break channel support and likely accelerate losses toward 4,200–4,220.
Risk remains elevated. The 20-day range of 482 points and elevated ATR mean stop-loss placement must be wide. A stop below 4,250 protects against a channel breakdown while allowing room for intraday noise. Until price reclaims the 4,440–4,460 zone and the 20-day SMA, the path of least resistance remains lower. This is a wait-and-see environment, not a high-conviction entry point.
Trade Parallel channel support and more on a real account — open one in minutes.
Open an account