
Daily Analysis EUR / USD Daily Falling wedge compression
EUR/USD Falling Wedge Tests Support Near 1.1457 Ahead of Potential Reversal
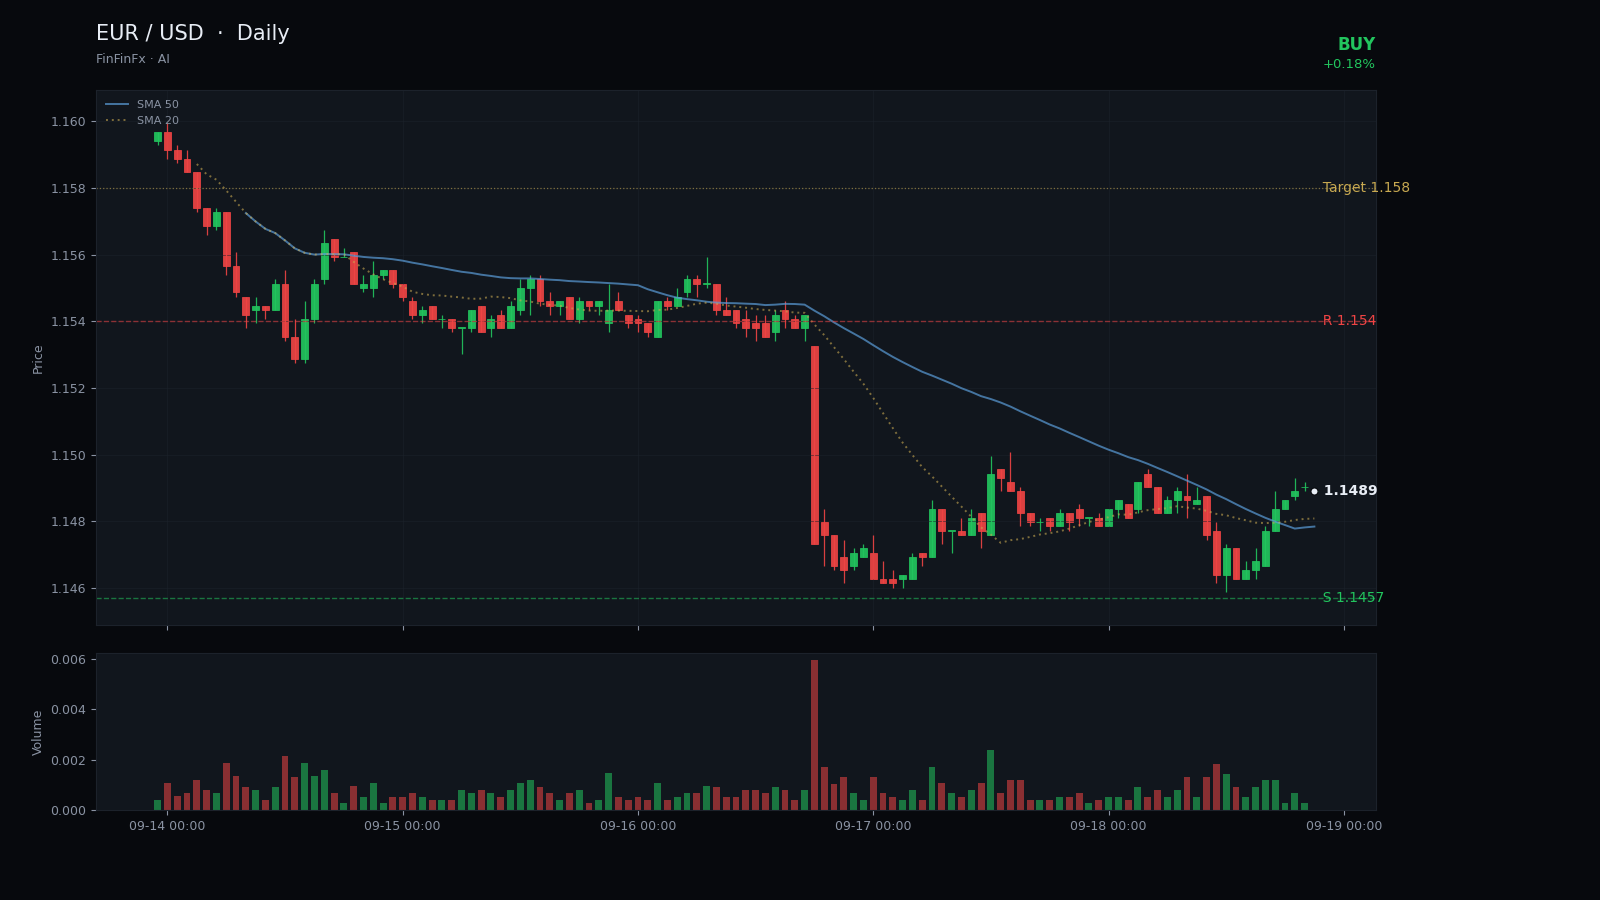
Trendline structure
Falling wedge compression-
Resistance Aug 20 descending resistance
This trendline connects the August 20 and September 10 highs, forming the upper boundary of the falling wedge that has capped every rally since late August.
Anchors: 2026-08-20 @ 1.1711 → 2026-09-10 @ 1.1643
-
Support Aug 31 wedge support
This support line runs from the August 31 low through the September 15 low, converging with resistance to form the falling wedge and now testing the 20-day low at 1.1457.
Anchors: 2026-08-31 @ 1.1589 → 2026-09-15 @ 1.1528
EUR/USD has carved out a falling wedge compression pattern over the past three weeks, a structure that often precedes bullish reversals when momentum indicators reach oversold territory. The upper boundary of this wedge connects the August 20 high at 1.1711 with the September 10 high at 1.1643, forming a descending resistance line that has capped every rally attempt since late August. The lower boundary runs from the August 31 low at 1.1585 through the September 15 low at 1.1528 and now tests the 20-day low at 1.1457. This converging channel has squeezed price into an increasingly narrow range, and yesterday's close at 1.1490 sits just 33 pips above that critical floor.
The pair is trading well below both its 5-day SMA at 1.1528 and 20-day SMA at 1.1605, confirming the recent downtrend remains intact on a moving-average basis. However, the RSI14 has dropped to 34.7, its lowest reading in the visible dataset, signaling that selling pressure may be exhausted. The 14-day ATR of 0.0048 (roughly 48 pips) suggests volatility remains elevated, giving any breakout room to run. Immediate resistance sits at 1.1540, the mid-August pivot zone, while the wedge's upper trendline currently intersects near 1.1560. A daily close above 1.1540 would confirm the first higher high in three weeks and validate the falling wedge breakout thesis.
We favor a tactical long entry at current levels near 1.1490, targeting 1.1580—a measured move that projects the widest part of the wedge from the breakout point. Primary support lies at 1.1457, the 20-day low and the lower wedge boundary. A stop-loss at 1.1430, roughly 60 pips below entry, sits beneath the psychological 1.1450 handle and provides a clear invalidation point. This setup offers a reward-to-risk ratio near 1.5:1. The call is invalidated if price breaks below 1.1430 on a closing basis, which would suggest the wedge is a continuation pattern rather than a reversal and open the door to a test of 1.1400 or lower. Until then, the combination of oversold RSI, converging trendlines, and proximity to multi-week support tilts the near-term risk-reward in favor of a bounce.
Trade Aug 31 wedge support and more on a real account — open one in minutes.
Open an account