
Daily Analysis Bitcoin / USD Daily V-shaped reversal breakout
Bitcoin Surges Above 81K After Sharp V-Reversal, Bullish Momentum Building
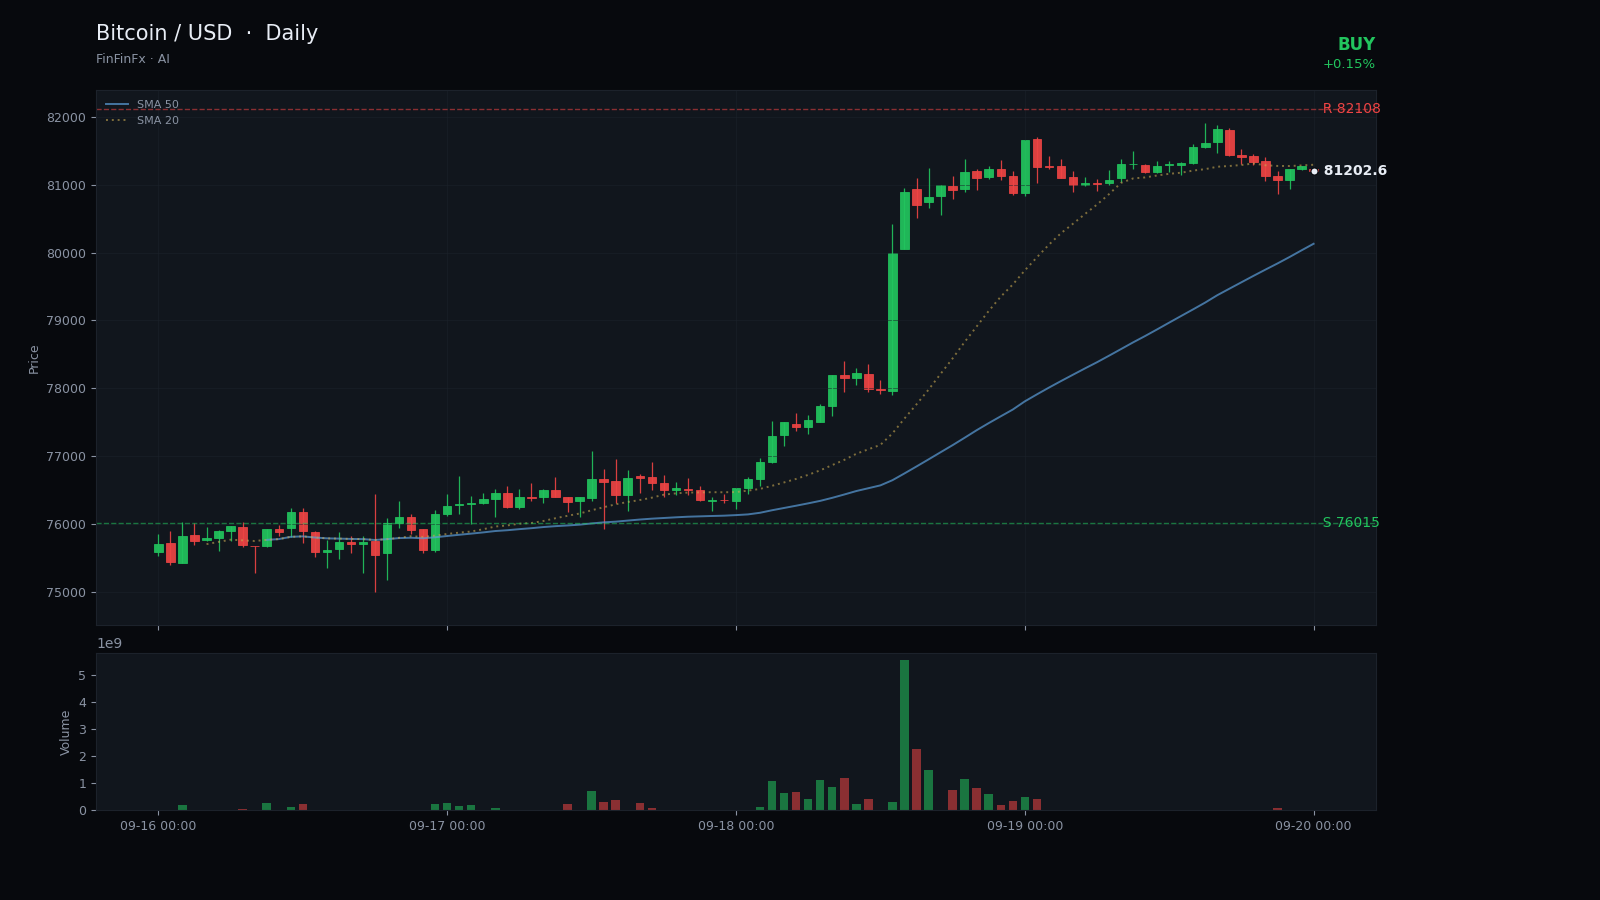
Trendline structure
V-shaped reversal breakout-
Support Aug 21 rising support
This ascending trendline connects the August 21 and September 15 lows, defining the floor of the recent consolidation and confirming accumulation at higher levels.
Anchors: 2026-08-21 @ 72,500.00 → 2026-09-15 @ 75,038.00
-
Resistance Sep 4 resistance zone
Horizontal resistance at the September 4 high marks the ceiling of the 20-day range and the key breakout level to watch.
Anchors: 2026-09-04 @ 82,108.00 → 2026-09-19 @ 81,864.00
Bitcoin has printed a sharp V-shaped reversal breakout over the past two sessions, climbing from the 75,038 low on September 15 to close at 81,315 on September 19. The most important structural feature is the rising support trendline that connects the August 21 low at 72,500 and the September 15 low at 75,038. This line has defined the floor of the recent consolidation and confirms that buyers have been willing to step in at progressively higher levels, a classic sign of accumulation. Price respected this support twice before launching the current rally, and the trendline now sits near 76,000, roughly 6.5% below the current close.
Overhead, resistance is clearly marked at 82,108, the September 4 high and the top of the 20-day range. A daily close above this level would open the door to a measured move toward 84,500, derived from the height of the recent consolidation zone. Support is layered: the immediate floor is the September 16 low at 76,015, which aligns closely with the rising trendline. A break below 76,000 would call the bullish structure into question. The five-day moving average at 78,230 has crossed above the 20-day at 78,473, a minor bullish signal, though the proximity of the two averages suggests the trend is still early. RSI at 55.9 sits in neutral territory with room to run before overbought conditions, and the 14-day ATR of 2,023 points reflects elevated volatility, typical after a sharp reversal.
The call is to buy on a pullback toward 79,200–79,500, targeting 84,500 with a stop below 79,200. This level sits just beneath the recent breakout candle and above the rising support trendline, offering a logical invalidation point. The V-shaped reversal breakout pattern is confirmed by the 6.1% single-day surge on September 18, which reclaimed the upper half of the range. However, if price closes below 79,200, it would suggest the breakout was premature and that the market needs more time to build a base. Until then, the bias remains cautiously bullish, with the structure favoring higher prices as long as the rising support trendline holds.
Trade Sep 4 resistance zone and more on a real account — open one in minutes.
Open an account