
Daily Analysis Bitcoin / USD Daily Ascending channel breakout attempt
Bitcoin Tests Upper Channel Resistance After Steady July Recovery Rally
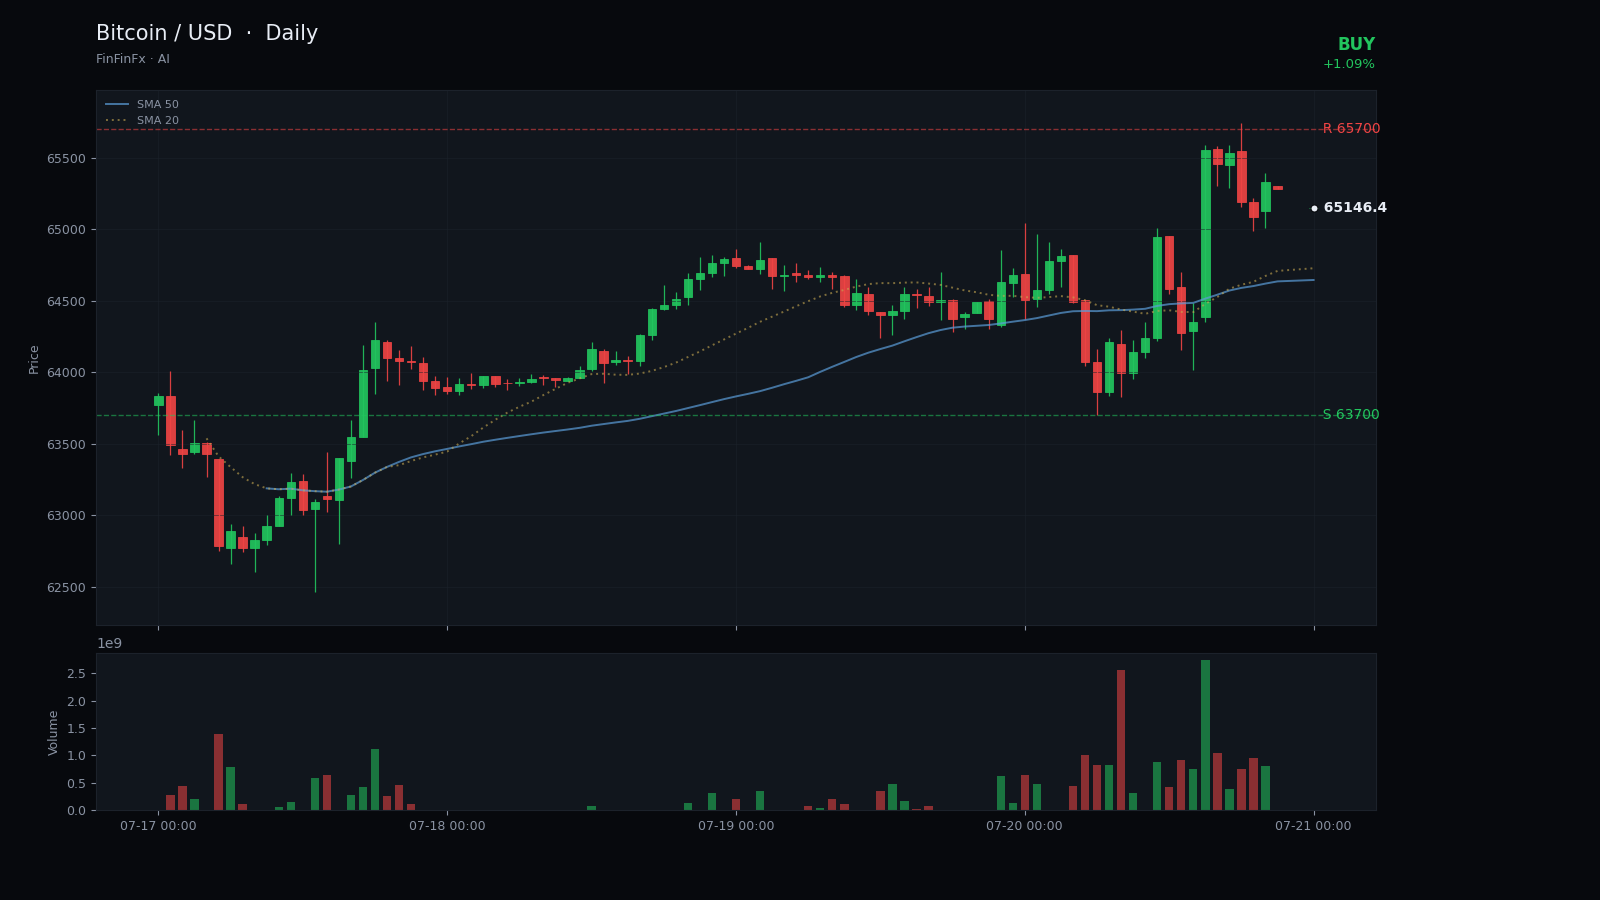
Trendline structure
Ascending channel breakout attempt-
Support Rising channel support
This ascending support line has guided Bitcoin's recovery from the late-June lows and defines the lower boundary of the bullish channel.
Anchors: 2026-06-25 @ 58,189.00 → 2026-07-08 @ 61,550.00
-
Resistance Channel resistance line
The upper boundary of the ascending channel connects recent highs and marks the breakout threshold that Bitcoin is currently testing.
Anchors: 2026-06-22 @ 65,469.00 → 2026-07-20 @ 65,697.00
Bitcoin has carved out a well-defined ascending channel since late June, when price bottomed near 57,945 on July 1st. The lower boundary of this channel connects the June 25th low at 58,189 with the July 8th swing low at 61,550, forming a rising support line that has guided the recovery over the past three weeks. Price has respected this structure through multiple tests, most recently bouncing from the 63,866 low on July 16th. The upper boundary, drawn from the June 22nd peak at 65,469 through yesterday's 65,697 high, now defines immediate resistance and marks the breakout threshold for the next leg higher.
Current price action shows Bitcoin closing at 65,093 after probing that upper channel resistance intraday on July 20th. The 5-day moving average at 64,465 has crossed above the 20-day at 63,436, confirming short-term momentum has shifted bullish. RSI at 56.5 sits comfortably in neutral-to-bullish territory with room to run before overbought conditions emerge. The 14-day ATR of 1,502 points reflects elevated volatility, typical of a market attempting to resolve a multi-week pattern. Key horizontal support now rests at 63,700, aligning with the recent consolidation zone and the rising channel midpoint.
The call here is a cautious buy on the current close or a minor pullback toward 64,500, targeting the 67,500 zone if price clears 65,700 with conviction. This ascending channel breakout attempt carries moderate confidence because the structure is clean and the trend is intact, but resistance has proven sticky over the past month. A daily close above 65,700 would confirm the breakout and likely accelerate momentum toward the measured move target near 67,500. However, risk remains tangible: a breakdown below 63,200 would violate the rising support line and signal that the channel has failed, opening the door to a retest of the 61,500–62,000 zone. Position sizing should reflect this two-way risk, and stops below 63,200 are essential to protect capital if the structure breaks down.
Trade Channel resistance line and more on a real account — open one in minutes.
Open an account