
Daily Analysis Bitcoin / USD Daily High-level consolidation
Bitcoin Consolidates Near 64K After Testing July Highs
Trendline structure
High-level consolidation-
Support July rising support
This trendline connects the July 1 low and the July 14 swing low, defining the floor of the current recovery structure.
Anchors: 2026-07-01 @ 57,945.00 → 2026-07-14 @ 61,849.00
-
Resistance Near-term resistance ceiling
A flat resistance zone formed by the July 15 peak and recent highs, capping upside attempts in the consolidation.
Anchors: 2026-07-15 @ 65,437.00 → 2026-07-19 @ 64,866.00
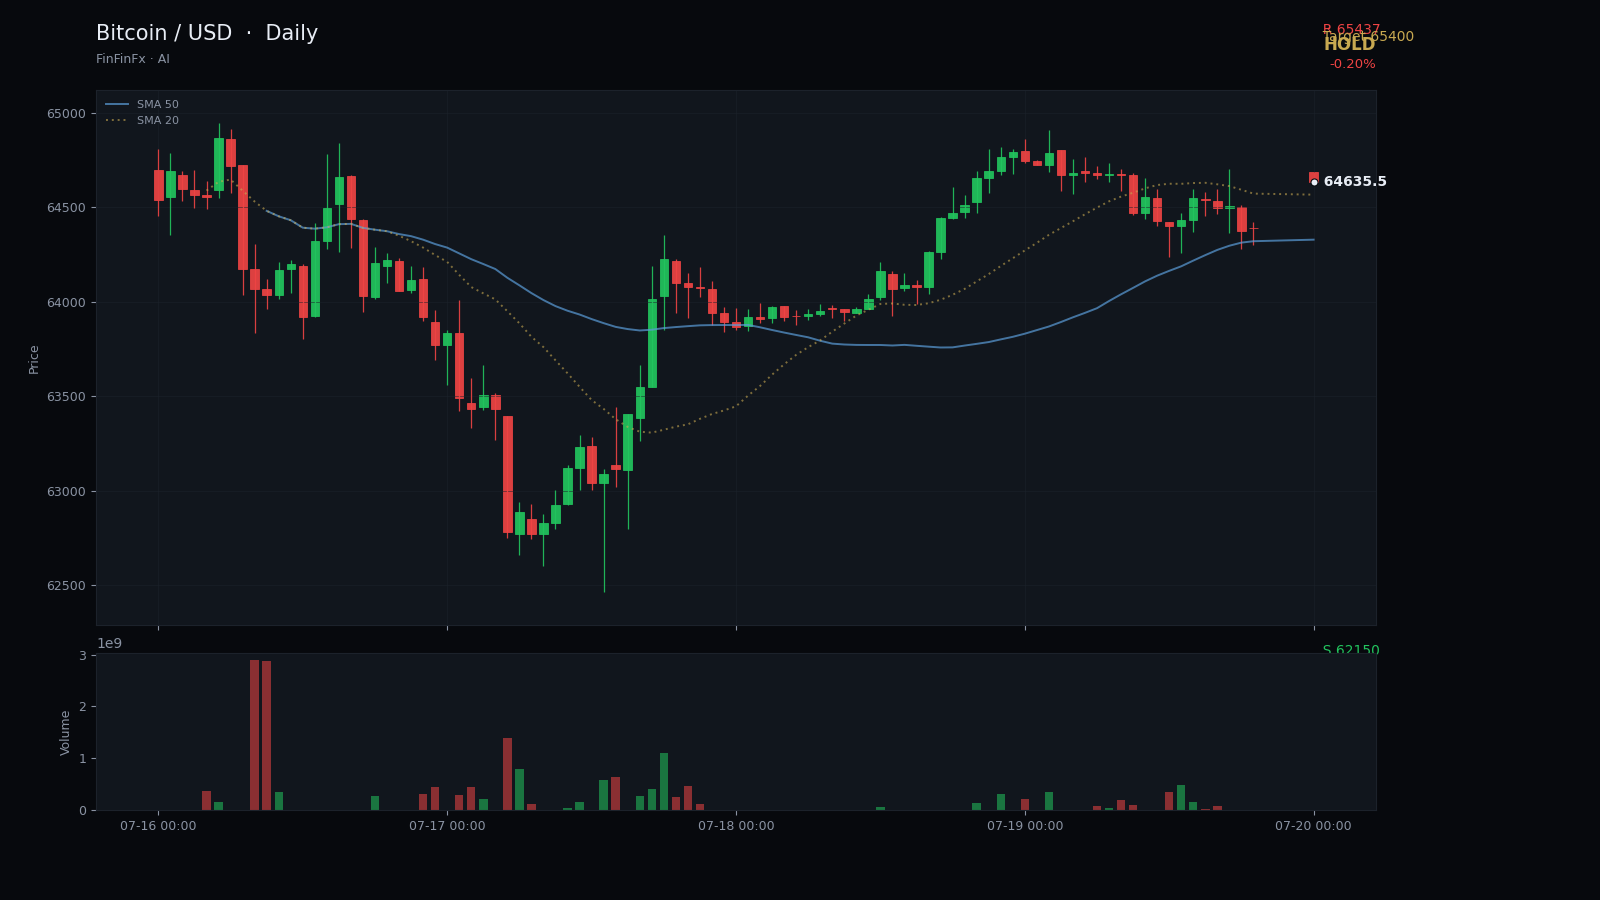
Bitcoin is trading in a narrow band just below its July peak, with Friday's close at 64,393 marking a modest 0.20% decline. The dominant structure on the daily chart is a rising support trendline that originates from the 57,945 low on July 1 and connects through the 61,849 swing low on July 14. This line has guided the recovery from late June's sharp selloff and currently sits near 62,800, providing a floor for the recent consolidation. Price has respected this support across multiple tests over the past three weeks, signalling that buyers remain engaged at higher lows.
Above current price, resistance is clearly defined by the 65,437 high printed on July 15. That level has capped two separate rallies in the past week, creating a ceiling that bulls have yet to break. The 5-day moving average at 64,431 is nearly flat and intertwined with price, while the 20-day SMA at 63,117 continues to slope upward, confirming that the medium-term bias remains constructive. The RSI reading of 57.7 sits in neutral territory—neither overbought nor oversold—suggesting the market has room to move in either direction without immediate momentum exhaustion.
The current setup is best described as high-level consolidation. Bitcoin is coiling between 62,150 horizontal support (a cluster of prior swing lows from July 8–13) and the 65,437 resistance. The ATR of 1,544 points indicates that daily volatility remains elevated, so a breakout or breakdown could unfold quickly. For now, the prudent stance is to hold and wait for a decisive move. A daily close above 65,437 on expanding volume would open the door toward the next psychological target near 66,000–67,000. Conversely, a breakdown below 62,150 would threaten the rising support trendline and likely trigger a retest of the 20-day SMA around 63,100, with further downside risk toward 61,800.
Risk management is paramount in this environment. The call is invalidated if price closes below 61,800, which would break both the rising trendline and the recent consolidation base, signalling that sellers have regained control. Until then, the structure favours patience over aggression, as neither bulls nor bears have shown a clear hand in the past five sessions.
Trade Near-term resistance ceiling and more on a real account — open one in minutes.
Open an account