
Daily Analysis Gold / USD Daily Descending channel breakdown
Gold Tests Channel Floor Near $3,985 After Multi-Week Decline
Trendline structure
Descending channel breakdown-
Resistance Jun 15 descending resistance
This trendline connects the June 15 and July 6 swing highs, defining the upper boundary of the three-week descending channel.
Anchors: 2026-06-15 @ 4,362.00 → 2026-07-06 @ 4,199.70
-
Support Jun 30 channel floor
This parallel support line ran through the June 30 and July 16 lows, marking the lower boundary of the channel that was recently broken.
Anchors: 2026-06-30 @ 3,962.50 → 2026-07-16 @ 3,972.60
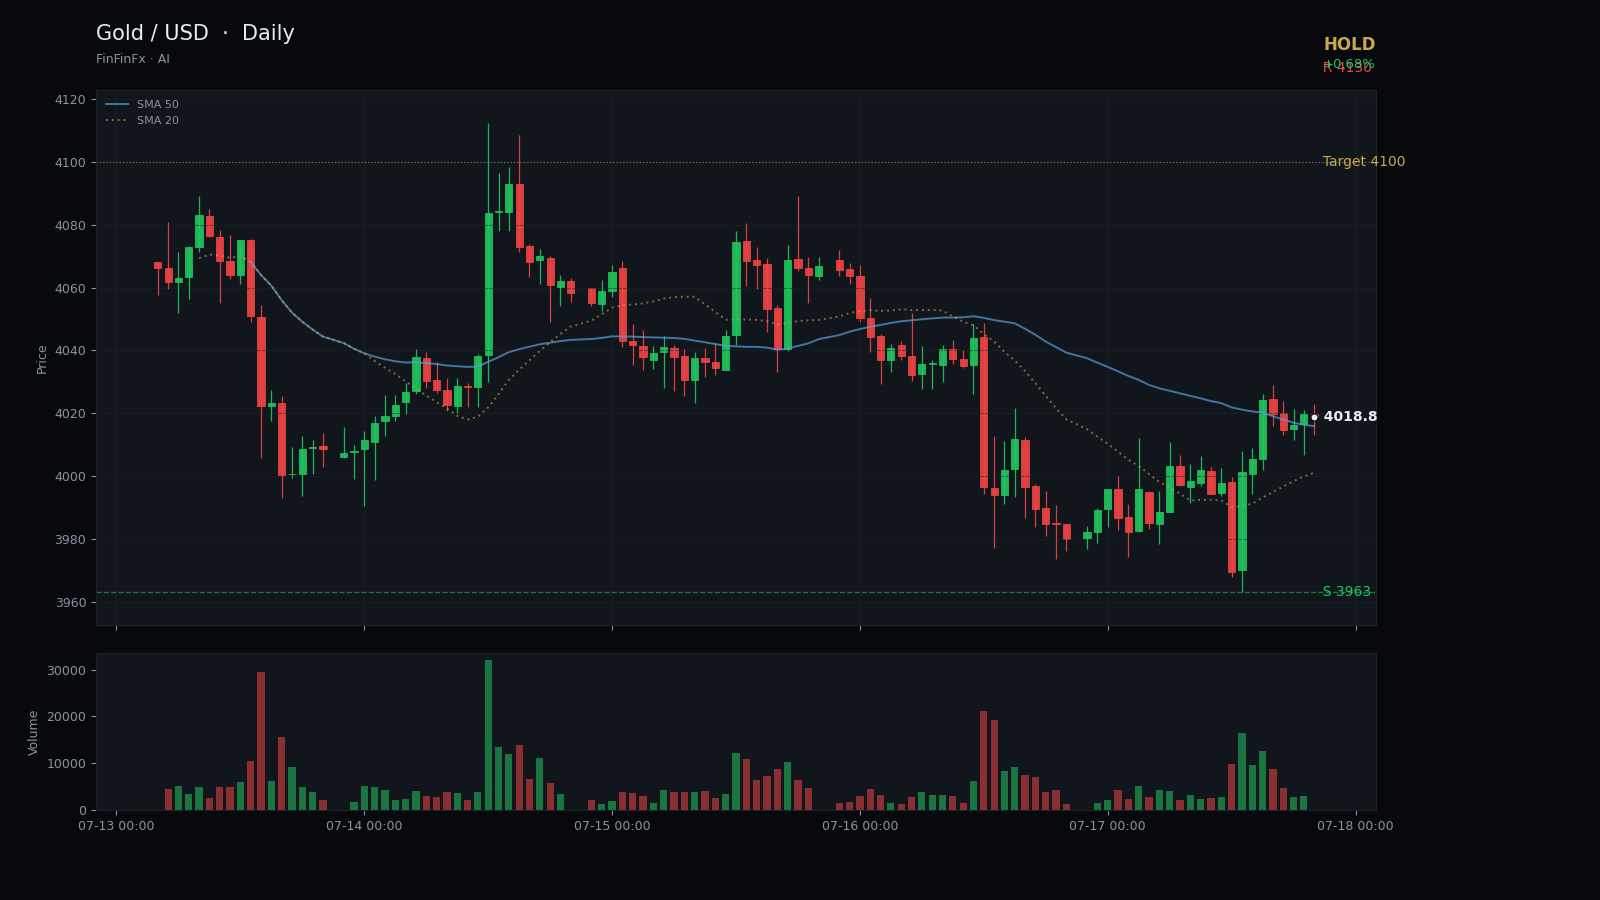
Gold has spent the past three weeks carving out a descending channel, with price making lower highs and lower lows from the June 4 peak near $4,510. The upper boundary of this channel connects the June 15 high at $4,362 and the July 6 high at $4,200, defining a clear zone of selling pressure. The parallel lower boundary ran through the June 30 low at $3,963 and the July 16 low at $3,973, offering temporary support—until yesterday's close at $4,013 confirmed a breakdown below that floor.
The 20-day range now spans $3,963 to $4,323, with price currently sitting just $50 above the lower boundary. The five-day moving average at $4,020 has rolled over and now sits below the 20-day SMA at $4,078, a bearish configuration that reflects the recent selling pressure. RSI14 at 44.8 is neither oversold nor overbought, suggesting the market has room to move in either direction without immediate technical extremes. ATR14 at 80.1 points indicates elevated volatility, typical of a market in transition.
Key resistance now lies at $4,130, the July 9 swing high and the most recent failed rally attempt. A sustained move above that level would be required to suggest the downtrend is reversing. Primary support sits at $3,963, the 20-day low and the former channel floor. A clean break and hold below $3,963 would open the door to further downside, potentially toward the $3,900 psychological zone.
Given the breakdown from the descending channel and the lack of bullish momentum, the prudent stance is to hold and wait for clearer directional confirmation. A long entry near $3,985 could be considered if price stabilizes above $3,963 with a stop-loss at $3,940, targeting a retest of $4,100. However, any failure to hold $3,963 on a closing basis would invalidate this setup and suggest further weakness ahead. Until price reclaims the $4,130 resistance or establishes a higher low above $3,963, the path of least resistance remains uncertain.
Trade Jun 30 channel floor and more on a real account — open one in minutes.
Open an account