
Daily Analysis Oil / USD Daily Overbought bounce from downtrend
Oil Rallies Into Resistance After Sharp Recovery From July Lows
Trendline structure
Overbought bounce from downtrend-
Resistance June descending resistance
This falling trendline connects the June highs and has capped every rally attempt, defining the upper boundary of the downtrend channel.
Anchors: 2026-06-04 @ 95.9100 → 2026-06-11 @ 93.6400
-
Support July rising support
This ascending trendline captures the recent recovery momentum from the July lows and forms the lower boundary of a contracting wedge.
Anchors: 2026-07-02 @ 67.0400 → 2026-07-10 @ 70.7700
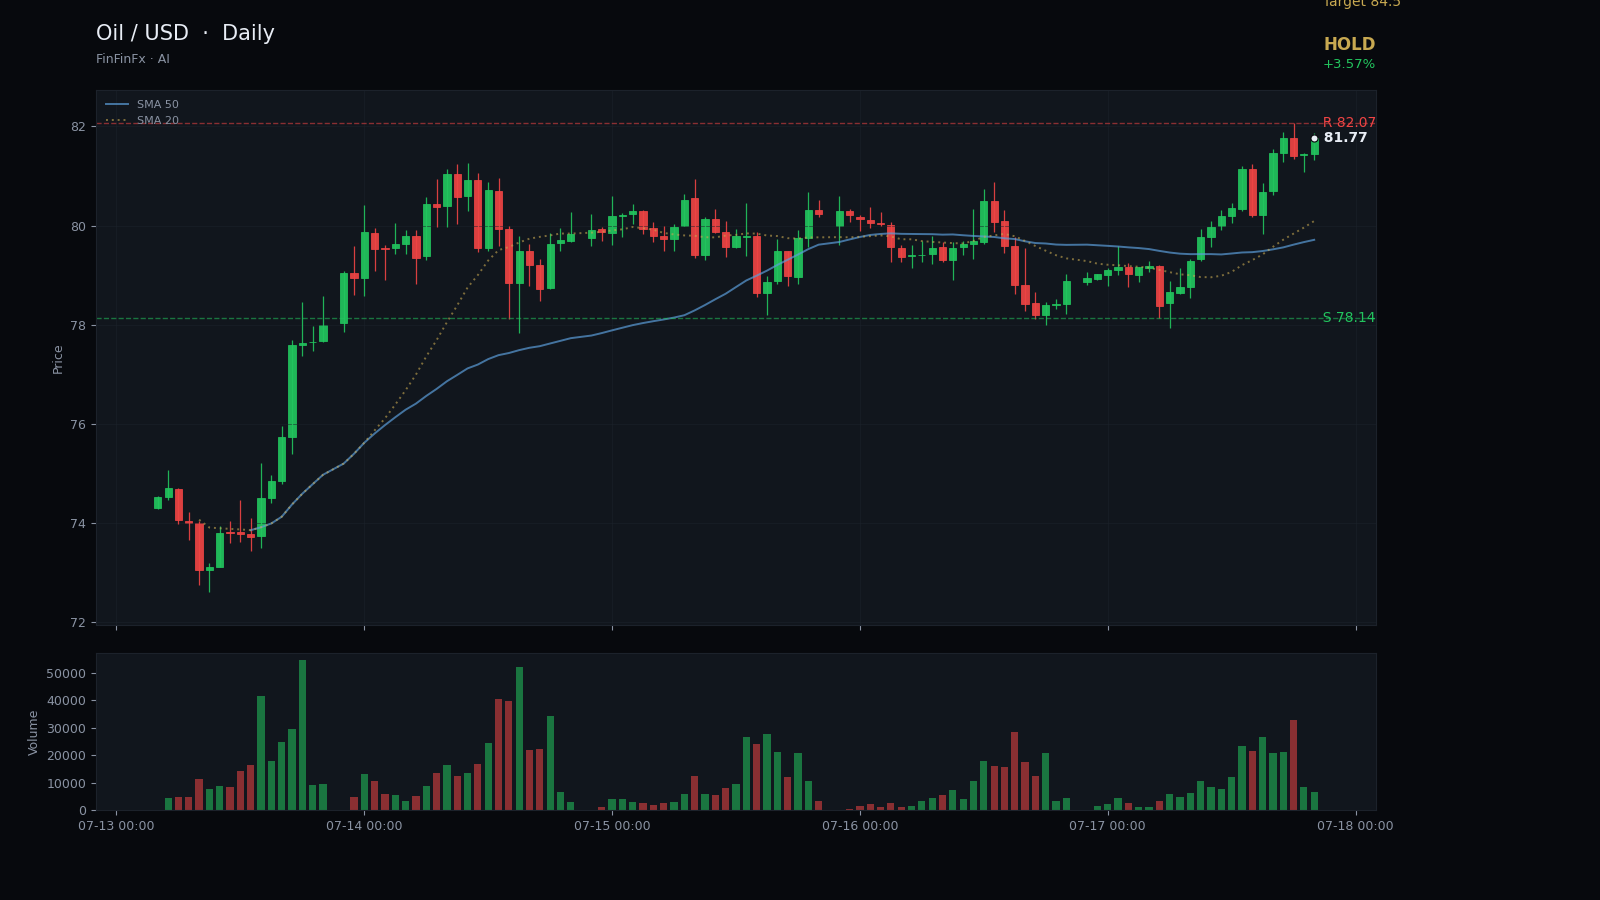
Oil has staged a powerful four-session rally from the July 2 low of 67.04, climbing more than 21% to close at 81.77 on July 17. The move has been steep enough to push RSI14 to 77.65, well into overbought territory, while the 5-day moving average at 79.56 has crossed decisively above the 20-day at 73.37. Despite this impressive bounce, the broader structure remains bearish: a descending resistance trendline connecting the June 4 high of 95.91 and the June 11 high of 93.64 continues to cap rallies, and price has yet to reclaim the psychological 85 level that acted as support before the mid-June breakdown.
The most important trendline on this chart is the falling resistance that originates from the June peaks. This line has guided the entire selloff and defines the upper boundary of the downtrend channel. On the support side, a rising trendline drawn from the July 2 low at 67.04 through the July 10 swing low at 70.77 captures the recent recovery momentum. Together, these two lines form a contracting wedge, suggesting that a breakout—either direction—may be imminent. For now, price is testing immediate resistance at 82.07, the intraday high printed today, which also aligns closely with the descending trendline.
Key horizontal support sits at 78.14, the July 13 breakout level that launched the current rally. A daily close below that mark would signal exhaustion and likely trigger profit-taking back toward the 73–74 zone. On the upside, a sustained break above 82.07 would open the door to 84.50 and potentially challenge the 87–88 region, where the market stalled in early June. However, given the elevated RSI reading and the proximity to overhead resistance, the risk-reward for fresh longs at current levels is unattractive.
The recommended stance is to hold and wait for either a pullback to support or a confirmed breakout above 82.07 with expanding volume. Entry at 81.77 is feasible only for traders already positioned; new entries should wait for clearer confirmation. A stop-loss below 76.50 protects against a failure of the recent low structure, while a target of 84.50 offers a modest 1.5:1 reward-to-risk ratio. This setup would be invalidated by a daily close beneath 76.50, which would reopen the path to the 67–70 lows and confirm that the rally was merely a bear-market bounce within a larger downtrend.
Trade July rising support and more on a real account — open one in minutes.
Open an account