
Daily Analysis Bitcoin / USD Daily Range-bound consolidation
Bitcoin Consolidates Near 64K as Bulls and Bears Remain Balanced
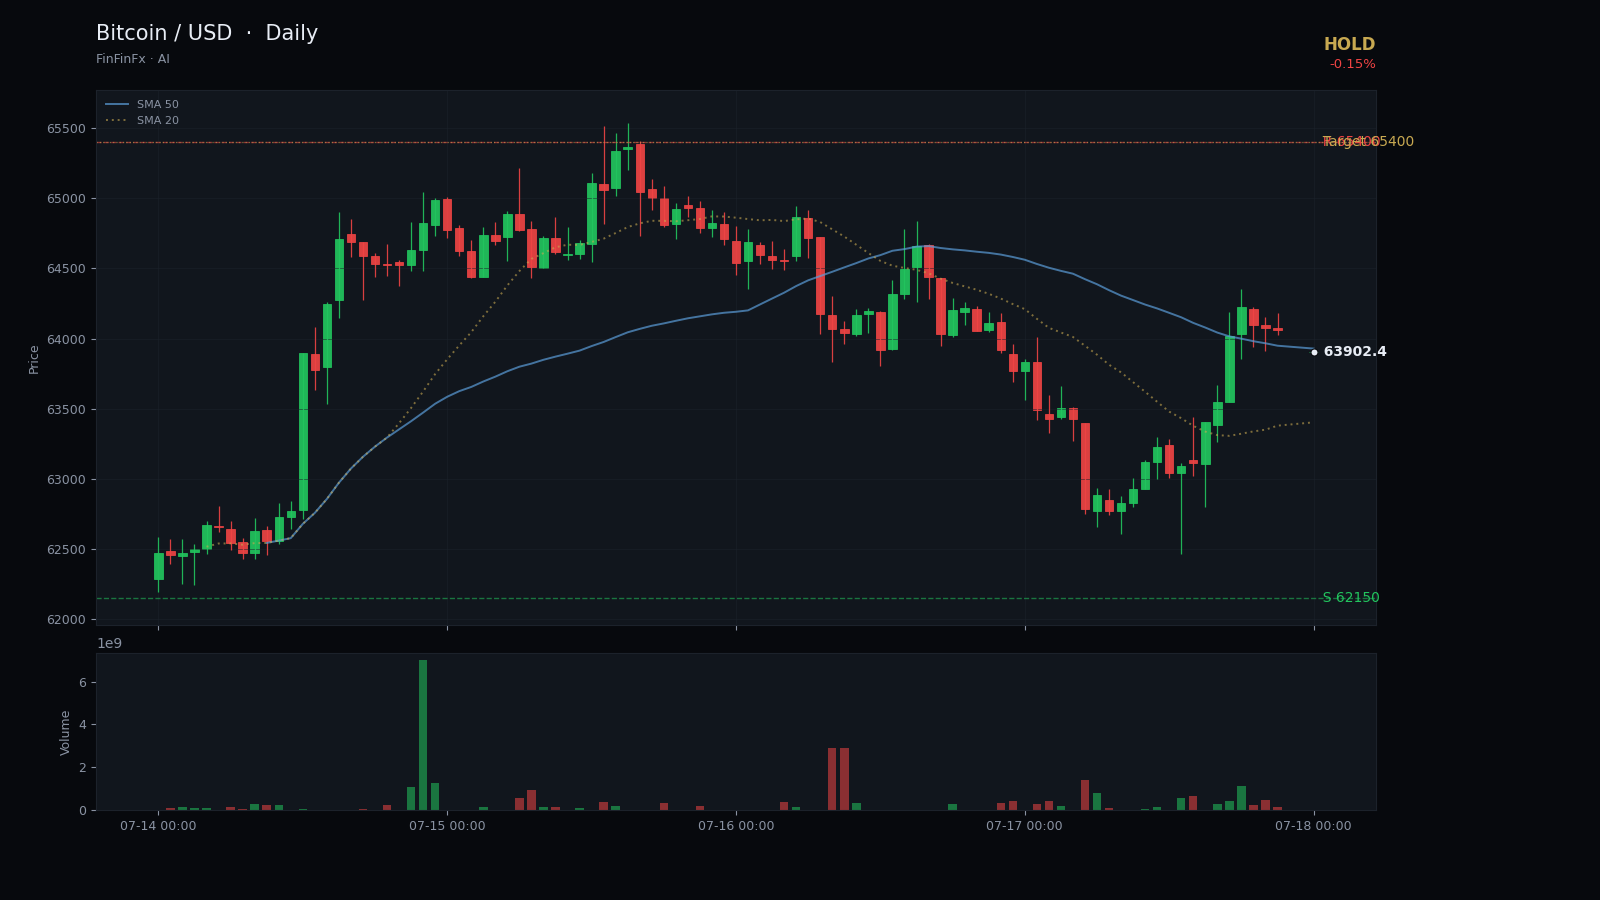
Trendline structure
Range-bound consolidation-
Support July rising support
This ascending trendline connects the July 1 capitulation low and the July 8 swing low, guiding the recovery and defining the lower boundary of the current consolidation.
Anchors: 2026-07-01 @ 57,945.00 → 2026-07-08 @ 61,550.00
-
Resistance June–July resistance ceiling
This horizontal resistance connects the June 22 high and the July 15 peak, capping rallies and marking the upper boundary of the consolidation zone.
Anchors: 2026-06-22 @ 65,469.00 → 2026-07-15 @ 65,437.00
Bitcoin has spent the past two weeks carving out a well-defined consolidation zone between 62,150 and 65,437. The 20-day high at 65,437 printed on July 15, while the 20-day low at 57,945 marked the June capitulation wick. Since early July, price has respected a rising support trendline anchored at the July 1 low of 57,945 and reinforced at the July 8 swing low of 61,550. This line has guided the recovery from late June's sell-off and now sits near 62,150, forming the lower boundary of the current range.
Overhead, resistance clusters tightly between 64,800 and 65,437. The July 15 high at 65,437 capped the most recent rally, and subsequent attempts to reclaim that level have been met with profit-taking. The 5-day simple moving average at 63,997 is threading just below the last close of 64,111, while the 20-day SMA at 62,660 provides a secondary support cushion. The 14-period RSI at 58.1 sits in neutral territory—neither overbought nor oversold—reflecting the balanced tug-of-war between buyers and sellers. Average true range of 1,603 points underscores the volatility embedded in this consolidation, meaning a breakout in either direction could be swift.
Given the lack of directional conviction, the prudent stance is to hold and wait for a confirmed breakout above 65,400 or a breakdown below 62,150. A daily close above resistance would open the door to a measured move toward 66,500–67,000, while a failure below support risks a retest of the 60,000 psychological level. Entry at the current price of 64,111 carries elevated risk without a clear catalyst. If initiating a speculative position, a stop-loss beneath 61,800 would protect against a deeper correction that invalidates the range-bound consolidation pattern. Until one of these boundaries gives way, patience is the higher-probability play.
Trade June–July resistance ceiling and more on a real account — open one in minutes.
Open an account