
Daily Analysis Gold / USD Daily Oversold descending channel
Gold Oversold Near Channel Support – Tactical Bounce Setup Emerges
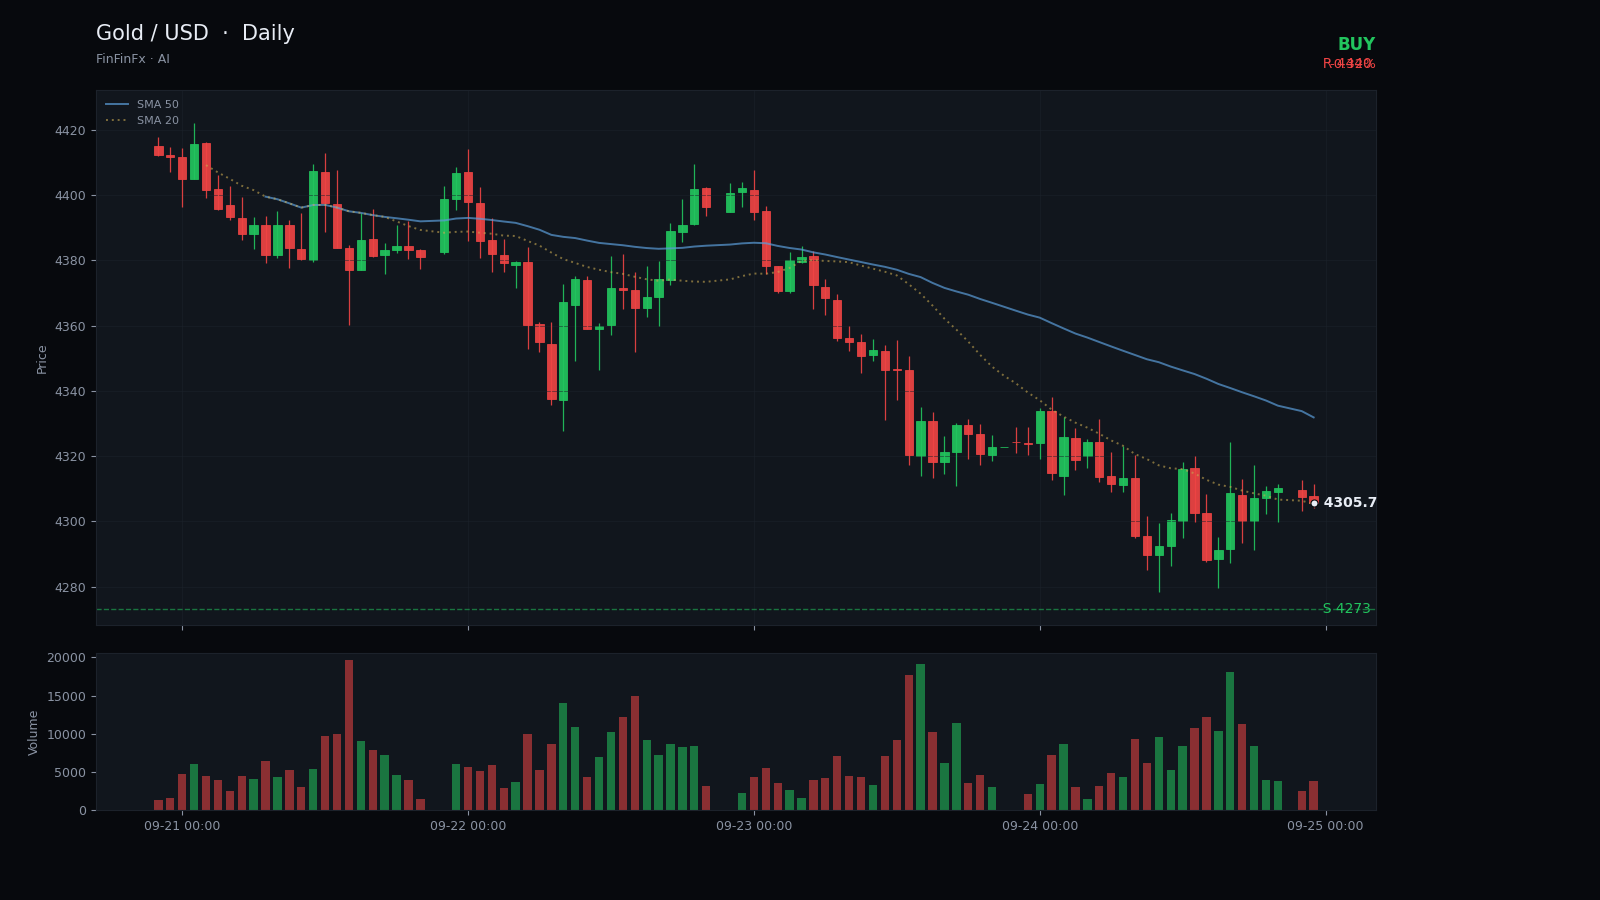
Trendline structure
Oversold descending channel-
Support Sep 14 channel support
This rising support line connects the 14 September low and today's intraday dip, forming the lower boundary of the three-week descending channel.
Anchors: 2026-09-14 @ 4,293.00 → 2026-09-24 @ 4,303.00
-
Resistance Aug 24 channel resistance
This descending resistance line links the 24 August all-time high and the 18 September peak, capping rallies and defining the upper channel boundary.
Anchors: 2026-08-24 @ 4,697.80 → 2026-09-18 @ 4,424.90
Gold has carved out a clear descending channel over the past three weeks, defined by a resistance line connecting the 24 August peak at 4697 and the 18 September high at 4424, and a parallel support line anchored at the 14 September low of 4293 and today's intraday dip to 4303. Price has respected both boundaries with precision: the 21 September and 23 September sessions each tested the upper channel boundary near 4420–4410 before rolling over, while yesterday's close at 4304 brought price within a few ticks of the lower channel support at 4273. This structure has aged twelve trading days and remains intact.
The 20-day low sits at 4273, a horizontal floor that has not yet been breached and now converges with the lower channel trendline. Resistance is layered: the 5-day SMA at 4362 and the 20-day SMA at 4425 both cap rallies, with the channel ceiling near 4440 forming the primary overhead barrier. RSI has plunged to 24.8, the deepest reading in this dataset and well into oversold territory, while ATR at 95.7 reflects elevated volatility that often precedes reversals. The pattern is an oversold descending channel, a setup that favours mean-reversion trades when momentum indicators reach extremes.
We are calling a tactical buy at 4305, targeting a bounce to 4475—roughly the midpoint of the channel and the 20-day SMA zone. The entry sits just above channel support, offering a tight risk profile with a stop-loss at 4255, below both the 4273 horizontal support and the lower trendline. Confidence is moderate at 62 out of 100; the downtrend remains in force, and any failure to hold 4273 would signal continuation lower, likely toward 4200. A daily close beneath 4255 invalidates the setup and suggests the channel has broken down. Conversely, a reclaim of 4362 and then 4400 would confirm the bounce and open the door to the 4440 resistance zone.
Trade Aug 24 channel resistance and more on a real account — open one in minutes.
Open an account