
Daily Analysis Gold / USD Daily Descending channel breakdown
Gold Tests Channel Floor After Sharp Decline, Neutral Bias Prevails
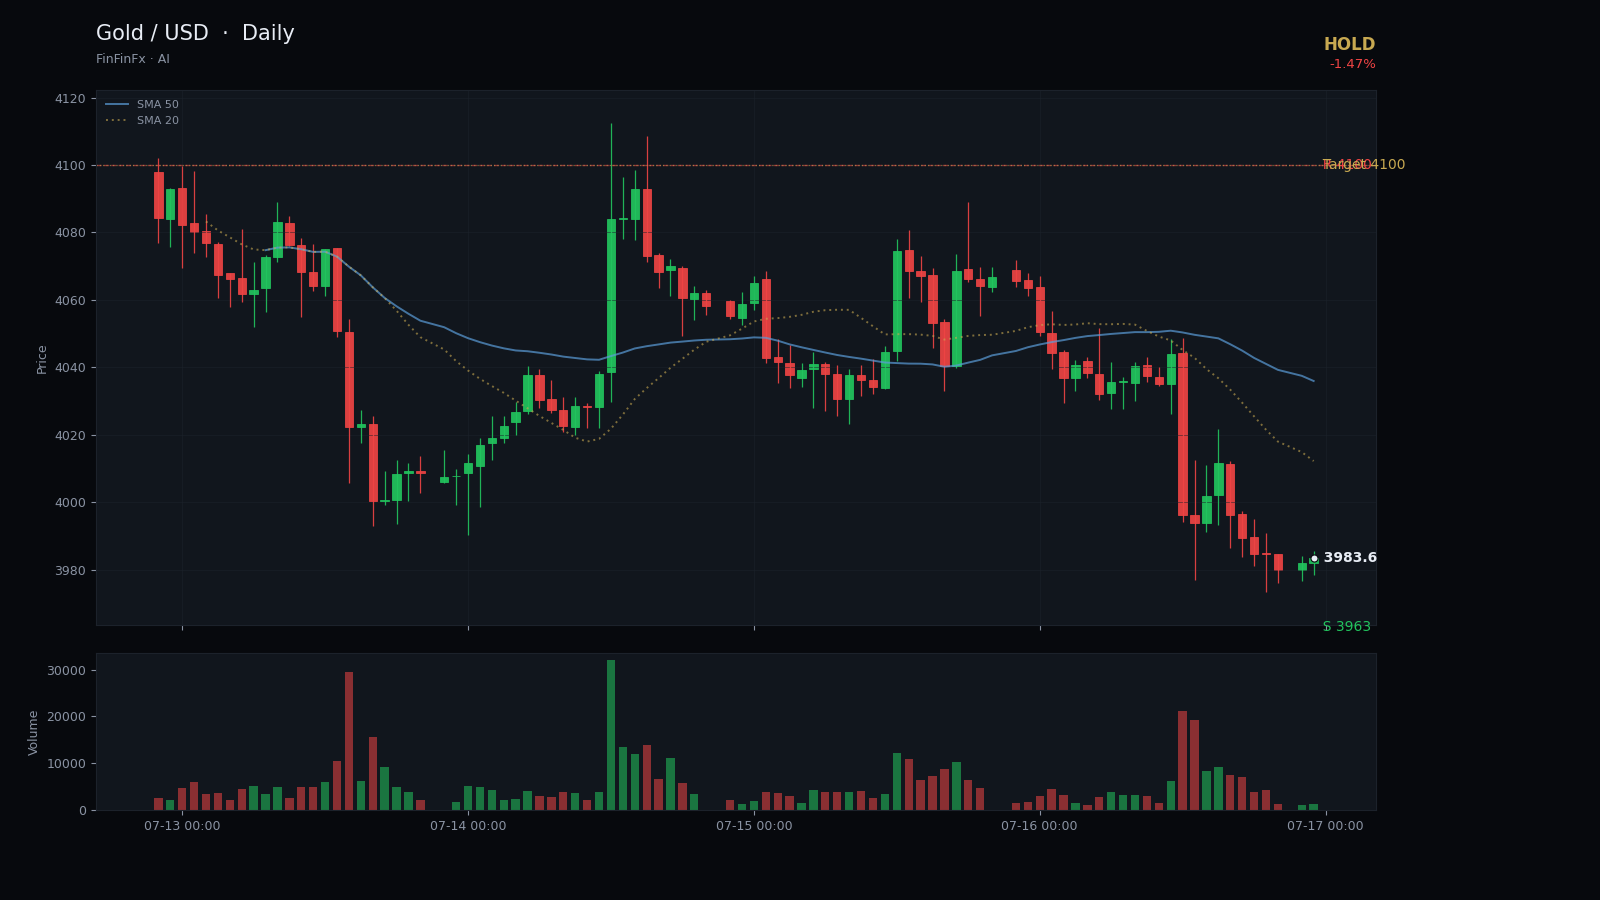
Trendline structure
Descending channel breakdown-
Support Jun descending support
This trendline connects the 10 June and 30 June lows, defining the lower boundary of the descending channel that has contained price for six weeks.
Anchors: 2026-06-10 @ 4,100.00 → 2026-06-30 @ 3,962.50
-
Resistance Jun descending resistance
This parallel resistance line connects the 4 June and 17 June highs, forming the upper boundary of the channel and capping all rally attempts since early June.
Anchors: 2026-06-04 @ 4,509.90 → 2026-06-17 @ 4,377.00
Gold has been trading within a well-defined descending channel since early June, with price respecting both the upper resistance trendline connecting the 4 June high at 4509.90 and the 17 June peak at 4377.00, and a parallel support line anchored at the 10 June low of 4100.00 and the 30 June bottom at 3962.50. This channel structure has guided price action for nearly six weeks, compressing volatility as the metal drifted lower within clear boundaries.
Yesterday's close at 3984.40 marks a decisive test of the lower channel boundary, with price now hovering just above the 20-day low of 3962.50. The 1.47% daily decline confirms renewed selling pressure, while the SMA5 at 4038.12 has crossed below the SMA20 at 4095.65, reinforcing the short-term bearish tilt. However, RSI14 at 46.48 sits in neutral territory—neither oversold nor overbought—suggesting the market has room to move in either direction without immediate momentum extremes.
Immediate support rests at 3963.00, the recent swing low that has held twice in the past three weeks. A clean break below this floor would open the door to further downside, potentially targeting the psychological 3900 zone. Resistance is clearly defined at 4100.00, the mid-channel pivot that has capped rallies on 1 July and 10 July. Any recovery attempt must reclaim this level to shift the near-term bias back toward neutral-to-bullish.
Given the descending channel breakdown pattern and the current position at channel support, a hold stance is warranted until price either confirms a breakdown below 3963.00 or stages a recovery back above 4100.00. Entry at current levels carries elevated risk without confirmation. A stop-loss below 3940.00 protects against a deeper flush, while the initial target at 4100.00 represents a return to resistance. This setup is invalidated if price closes decisively below 3940.00, signaling a broader breakdown, or if a sharp rally above 4100.00 negates the channel structure entirely.
Trade Jun descending resistance and more on a real account — open one in minutes.
Open an account