
Daily Analysis Gold / USD Daily Oversold capitulation bounce
Gold Oversold at 4157 After Sharp Decline – Tactical Bounce Setup
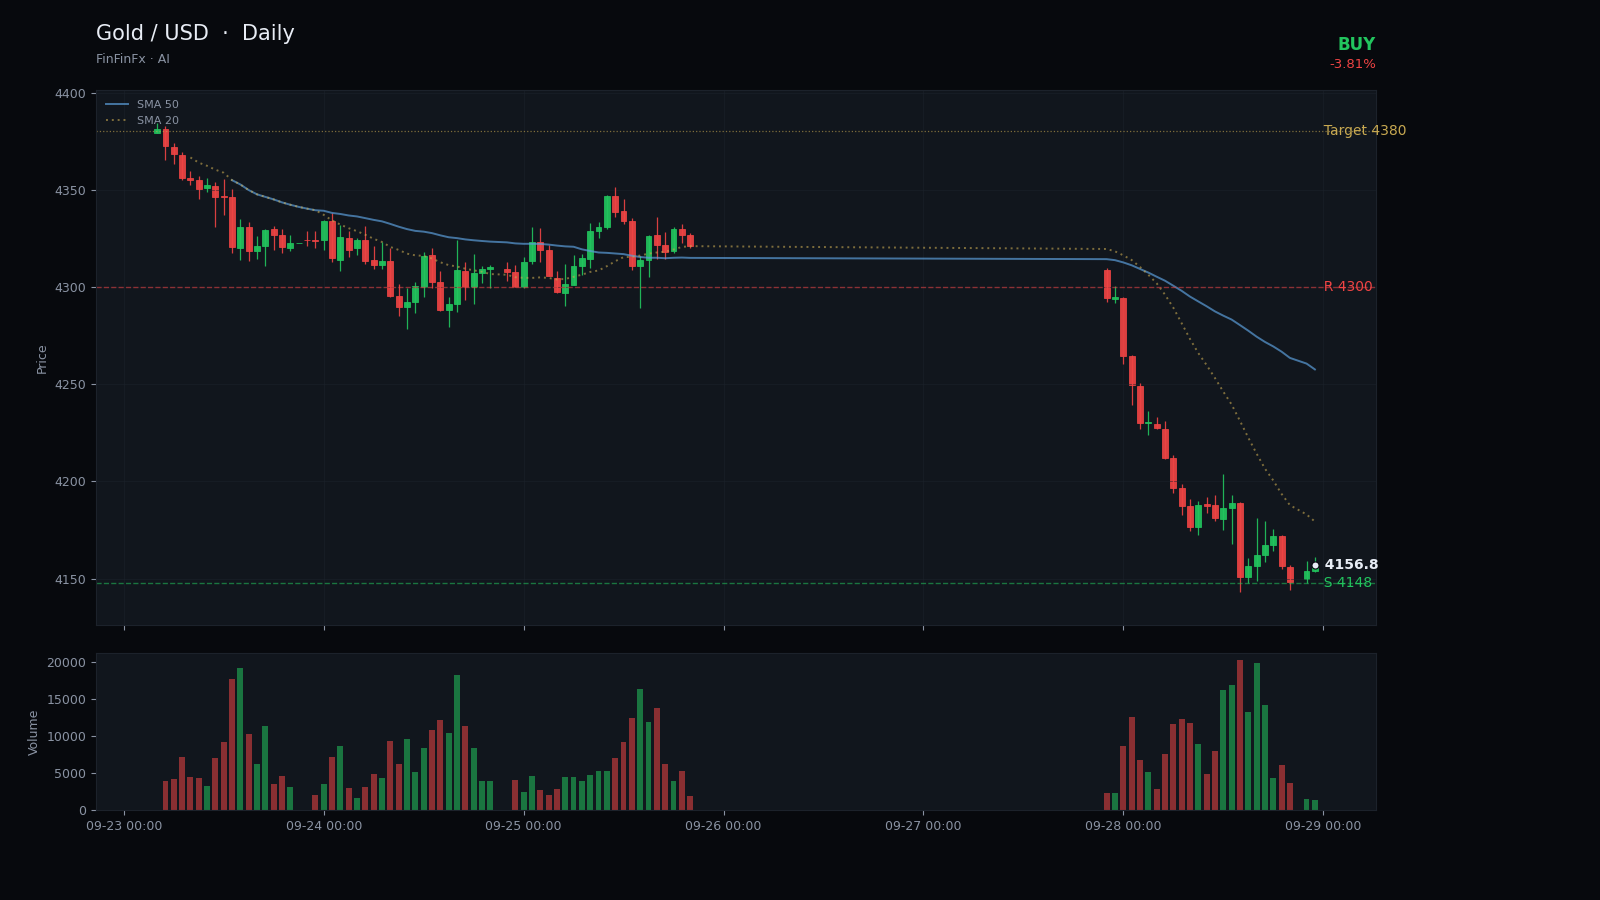
Trendline structure
Oversold capitulation bounce-
Resistance Aug 25 descending resistance
This resistance trendline connects the August 25 peak at 4755 with the September 3 high at 4558.50, defining the upper boundary of the descending channel that has capped rallies for the past month.
Anchors: 2026-08-25 @ 4,755.00 → 2026-09-03 @ 4,558.50
-
Support Channel support (now broken)
Parallel support line anchored at the August 31 low of 4445.60 and September 23 low at 4310.70, recently broken by today's decline, suggesting either capitulation or a false breakdown.
Anchors: 2026-08-31 @ 4,445.60 → 2026-09-23 @ 4,310.70
Gold has entered deeply oversold territory following a sharp 3.81% decline that brought the close to 4156.70, just nine dollars above the 20-day low of 4147.80. The RSI14 reading of 24.8 marks the most oversold condition in this data set, while price now trades 232 points below the SMA5 and 232 points below the SMA20, confirming aggressive bearish momentum. The descending channel that has governed price action since late August remains intact, defined by a resistance trendline connecting the August 25 high at 4755 and the September 3 peak at 4558.50, alongside a parallel support line anchored at the August 31 low of 4445.60 and the September 23 swing low at 4310.70. Today's close has pierced below this channel support, suggesting either a final capitulation move or a false breakdown that could spark a technical bounce.
The key support level sits at 4148, representing the 20-day low and the recent intraday low from September 28. This zone has absorbed selling pressure and marks the line between a corrective pullback and a more serious structural breakdown. Resistance is layered, with immediate overhead at 4300 (the September 24 low that has now flipped to resistance) and secondary resistance at 4380-4400, where the lower channel boundary and prior consolidation zones converge. The ATR14 of 98.86 indicates elevated volatility, meaning any reversal could be swift but also that whipsaws remain a risk.
The tactical call here is a counter-trend buy targeting an oversold bounce back toward 4380, predicated on the extreme RSI reading and the proximity to multi-week lows. Entry near 4160 offers a defined risk setup with a stop loss at 4120, roughly 30 points below the recent low to allow for minor probing. The target at 4380 represents a retest of the broken channel support-turned-resistance and aligns with the SMA5 descent trajectory. This is not a trend-reversal call but rather a mean-reversion trade capitalizing on stretched conditions. Invalidation would come from a daily close below 4120, which would open the door to further downside toward the 4050-4080 zone and confirm that the selling pressure has not yet exhausted itself.
Trade Channel support (now broken) and more on a real account — open one in minutes.
Open an account