
Daily Analysis Gold / USD Daily Oversold bounce setup
Gold Oversold Near Support – Tactical Bounce Opportunity Emerges at 4298
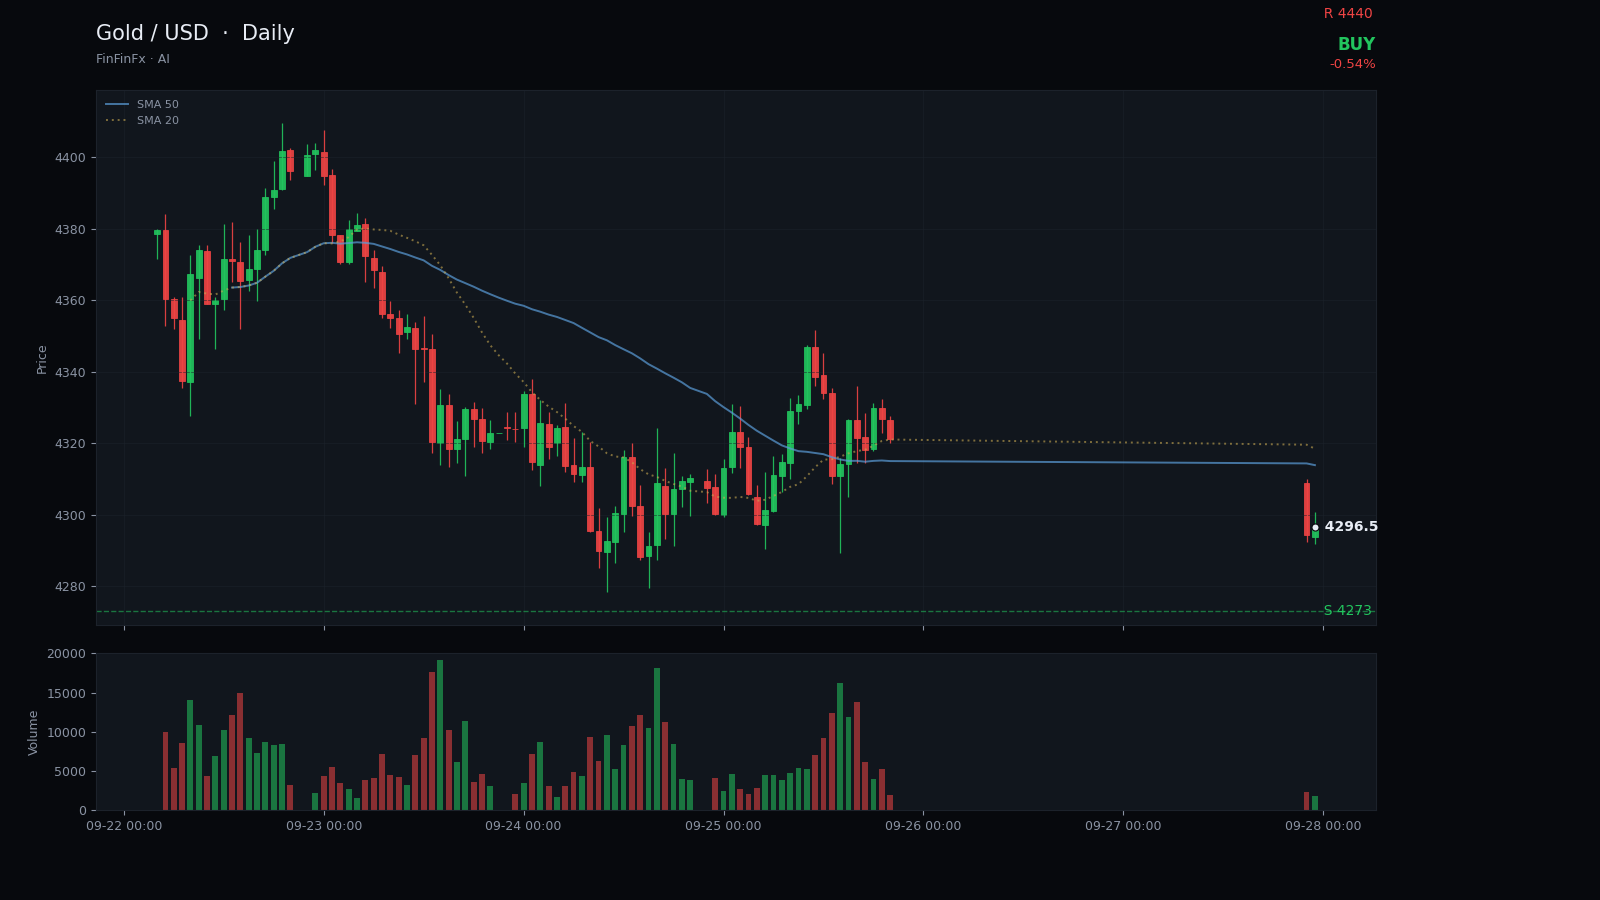
Trendline structure
Oversold bounce setup-
Support Channel support (Sep 2)
Rising support trendline connecting the September 2 low and current price zone, defining the lower boundary of the descending channel.
Anchors: 2026-09-02 @ 4,329.20 → 2026-09-27 @ 4,292.00
-
Resistance Channel resistance (Aug 25)
Descending resistance line from the August 25 peak through the September 3 high, capping all rallies within the channel.
Anchors: 2026-08-25 @ 4,755.00 → 2026-09-03 @ 4,558.50
Gold has carved out a clear descending channel over the past three weeks, with price making lower highs and lower lows inside parallel boundaries. The upper resistance trendline connects the August 25 peak at 4755 and the September 3 swing high at 4558, while the lower support trendline runs through the September 2 low at 4329 and yesterday's close near 4298. This channel has contained every rally and selloff since late August, giving traders a reliable framework for entries and exits.
Price is now testing the lower boundary of this channel at 4273, which also marks the 20-day low and a horizontal support zone forged during the September 16 spike low. The 14-period RSI has dropped to 33, its lowest reading in the dataset, signaling oversold conditions without yet reaching extreme capitulation territory. Meanwhile, the 5-day SMA at 4322 and the 20-day SMA at 4396 both sit well above current price, confirming the short-term downtrend remains intact but stretched.
The tactical case for a bounce rests on three pillars: the confluence of channel support and horizontal support near 4273–4298, the oversold RSI, and the recent deceleration in downside momentum—yesterday's range was notably tighter than the prior week's volatile swings. If buyers step in here, an initial move toward 4440 resistance would represent a retest of the mid-September consolidation zone and the descending channel's midpoint. A stronger recovery could extend to 4520, where the August 28 breakdown level and the 20-day SMA converge.
Entry at 4298 offers a defined risk point: a daily close below 4255 would break both the channel support and the recent low, invalidating the oversold bounce thesis and likely triggering another leg lower. Until that occurs, the risk-reward favors a mean-reversion trade within the established channel structure, though traders should remain cautious of the broader bearish trend reflected in the downward-sloping moving averages.
Trade Channel resistance (Aug 25) and more on a real account — open one in minutes.
Open an account