
Daily Analysis Gold / USD Daily Oversold bounce setup
Gold Oversold Near Support – Tactical Bounce Play Emerges at 4321
Trendline structure
Oversold bounce setup-
Support Aug 28 descending support
This trendline connects the August and September swing lows, defining the lower boundary of the descending channel and currently supporting price near 4320.
Anchors: 2026-08-28 @ 4,495.00 → 2026-09-16 @ 4,273.30
-
Resistance Aug 24 descending resistance
The upper channel boundary drawn from the late-August peak through mid-September highs, currently capping rallies near 4440.
Anchors: 2026-08-24 @ 4,738.50 → 2026-09-18 @ 4,439.80
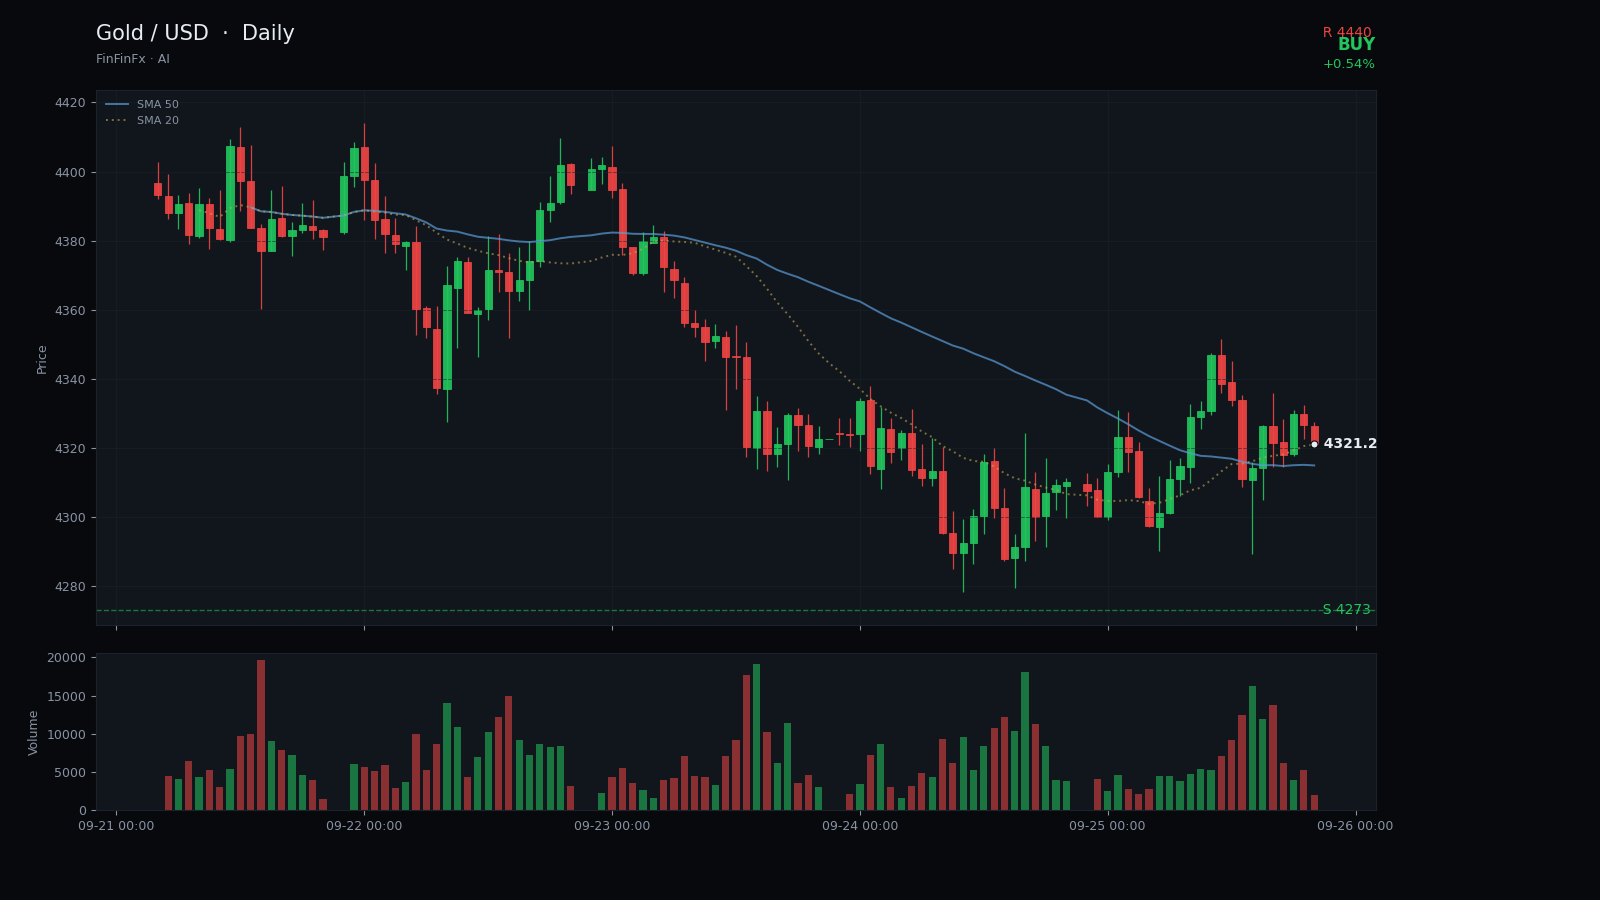
Gold has traced a clear descending channel since the late-August peak at 4738, with price carving lower highs and lower lows over the past four weeks. The upper boundary of this channel, connecting the 24 August and 18 September swing highs, currently sits near 4440 and has capped every rally attempt since early September. The lower boundary, drawn from the 28 August low at 4495 through the 16 September low at 4273, arrives today just beneath the current close at 4321. This lower trendline has been respected three times, and price is now testing it for a fourth time while RSI14 has dropped to 32—the most oversold reading in this dataset.
Horizontal support converges with the channel floor at 4273, the 20-day low and a level that has repeatedly attracted buyers. The 24 September session printed a low of 4278 before bouncing, and today's close at 4321 sits only 48 points above that zone. Meanwhile, resistance is layered: the first meaningful ceiling is the 5-day SMA at 4340, followed by the 4387–4400 zone where price stalled on 16–17 September, and then the channel top near 4440. The 20-day SMA at 4407 adds another overhead hurdle. ATR14 at 94 points confirms that volatility remains elevated, so any bounce can move quickly.
The call is a tactical long entry at current levels, targeting a mean-reversion rally toward 4475, just above the channel resistance and the 20-day SMA. The combination of oversold RSI, channel-support confluence, and proximity to the 20-day low offers a favorable risk-reward setup for a counter-trend bounce. A stop-loss at 4250 sits below the channel floor and the recent low, allowing room for intraday noise while protecting against a breakdown. This trade is invalidated if price closes below 4273 on heavy volume, which would signal that the descending channel has broken and a deeper correction toward 4200 or lower is underway. Until then, the technical structure favors a short-term rebound.
Trade Aug 24 descending resistance and more on a real account — open one in minutes.
Open an account