
Daily Analysis Bitcoin / USD Daily Post-breakout consolidation
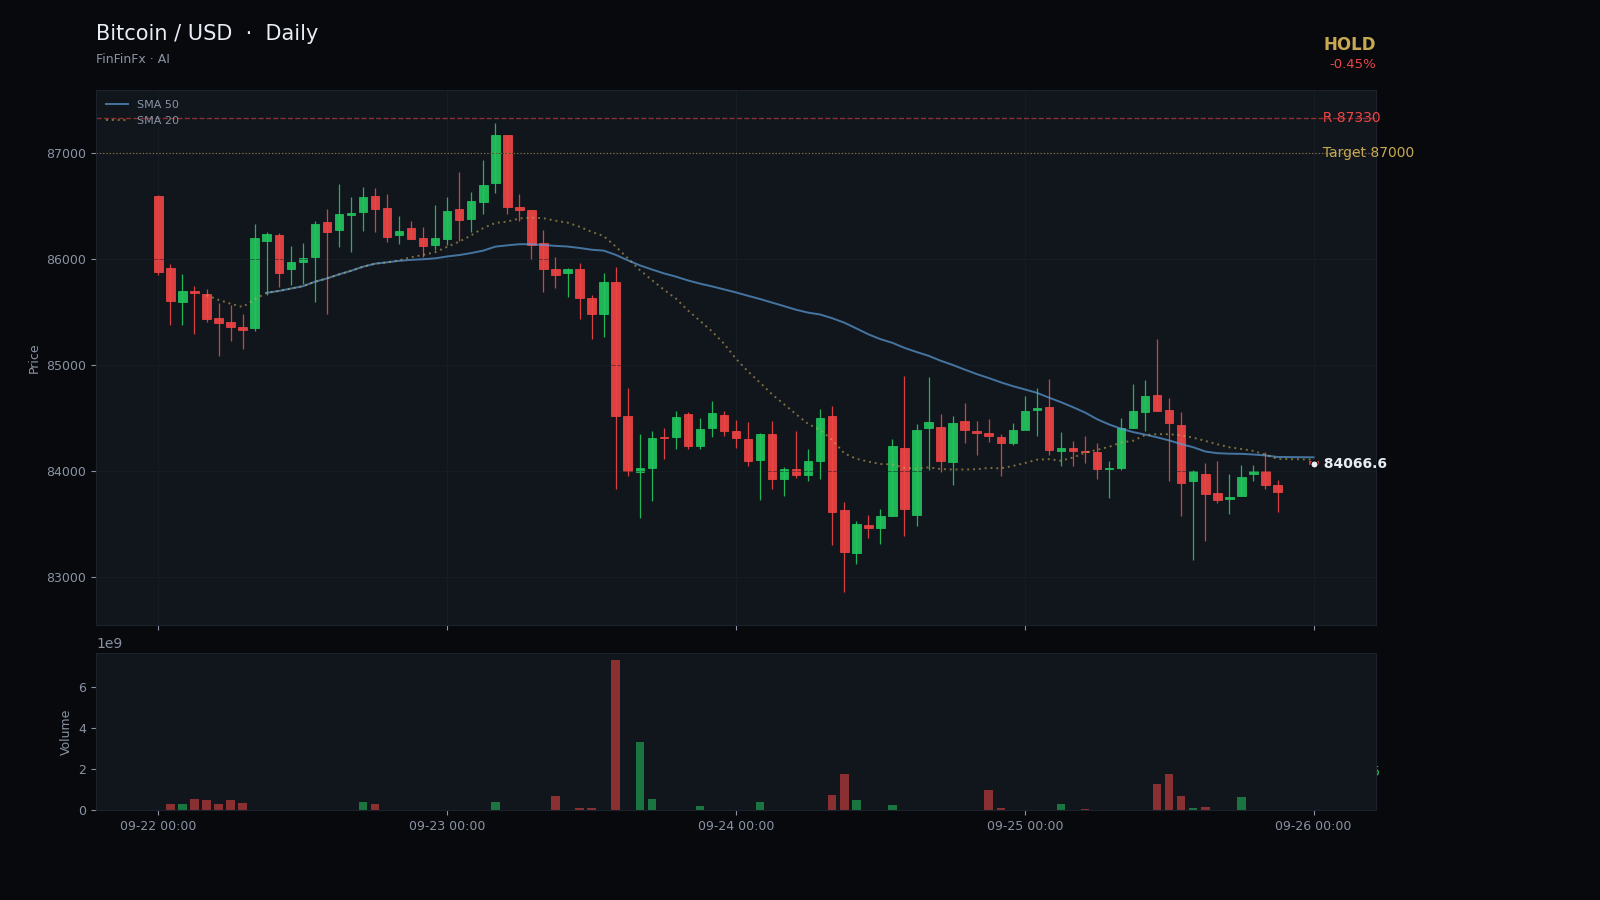
Bitcoin Consolidates After Sharp Rally, Holding Above 84K Support
Trendline structure
Post-breakout consolidation-
Support Mid-Sep rising support
This ascending trendline connects the September 15 capitulation low and the September 18 swing low, defining the lower boundary of the recent breakout rally.
Anchors: 2026-09-15 @ 75,038.00 → 2026-09-18 @ 76,205.00
Bitcoin has entered a consolidation phase after a powerful five-day rally that lifted price from 76K to a new 20-day high of 87,330 on September 22. The rising support trendline connecting the September 15 low at 75,038 and the September 18 swing low at 76,205 defines the lower boundary of the recent uptrend. Price has respected this line through four distinct touches, most recently on September 24, confirming its validity as a structural floor. The slope of this trendline suggests an aggressive bullish bias that emerged in mid-September.
The SMA5 at 85,128 sits above the current close of 84,006, while the SMA20 at 80,075 provides a secondary support layer roughly 5% below current levels. The 20-day range spans from 75,038 to 87,330, a 16% spread that reflects heightened volatility. The ATR14 reading of 2,477 confirms this environment, representing approximately 2.9% of price—traders should size positions accordingly. Resistance is clearly defined at the September 22 high of 87,330, a level that triggered a three-day pullback.
The RSI14 at 68.2 sits in the upper neutral zone, not yet overbought but close enough to warrant caution on fresh longs. The recent rally exhausted some momentum, and the past three sessions have printed inside bars with declining range, typical post-breakout consolidation behavior. Immediate support rests at 81,165, the September 20 close that marked the start of the final leg higher. A break below this level would shift the short-term structure bearish and likely test the SMA20 near 80K.
The call here is to hold rather than chase. Buyers who entered the breakout above 81K can maintain positions with stops below 80,000, targeting a retest of 87,000. New entries carry less favorable risk-reward given the proximity to resistance and elevated RSI. This setup invalidates on a daily close below 80,000, which would break both the rising trendline and the SMA20, signaling a deeper correction toward the mid-70K zone. Until then, the structure remains constructive but stretched.
Trade Mid-Sep rising support and more on a real account — open one in minutes.
Open an account