
Daily Analysis Oil / USD Daily Volatile retracement from spike high
Oil Consolidates After Sharp Decline; Neutral Bias Near 94 USD
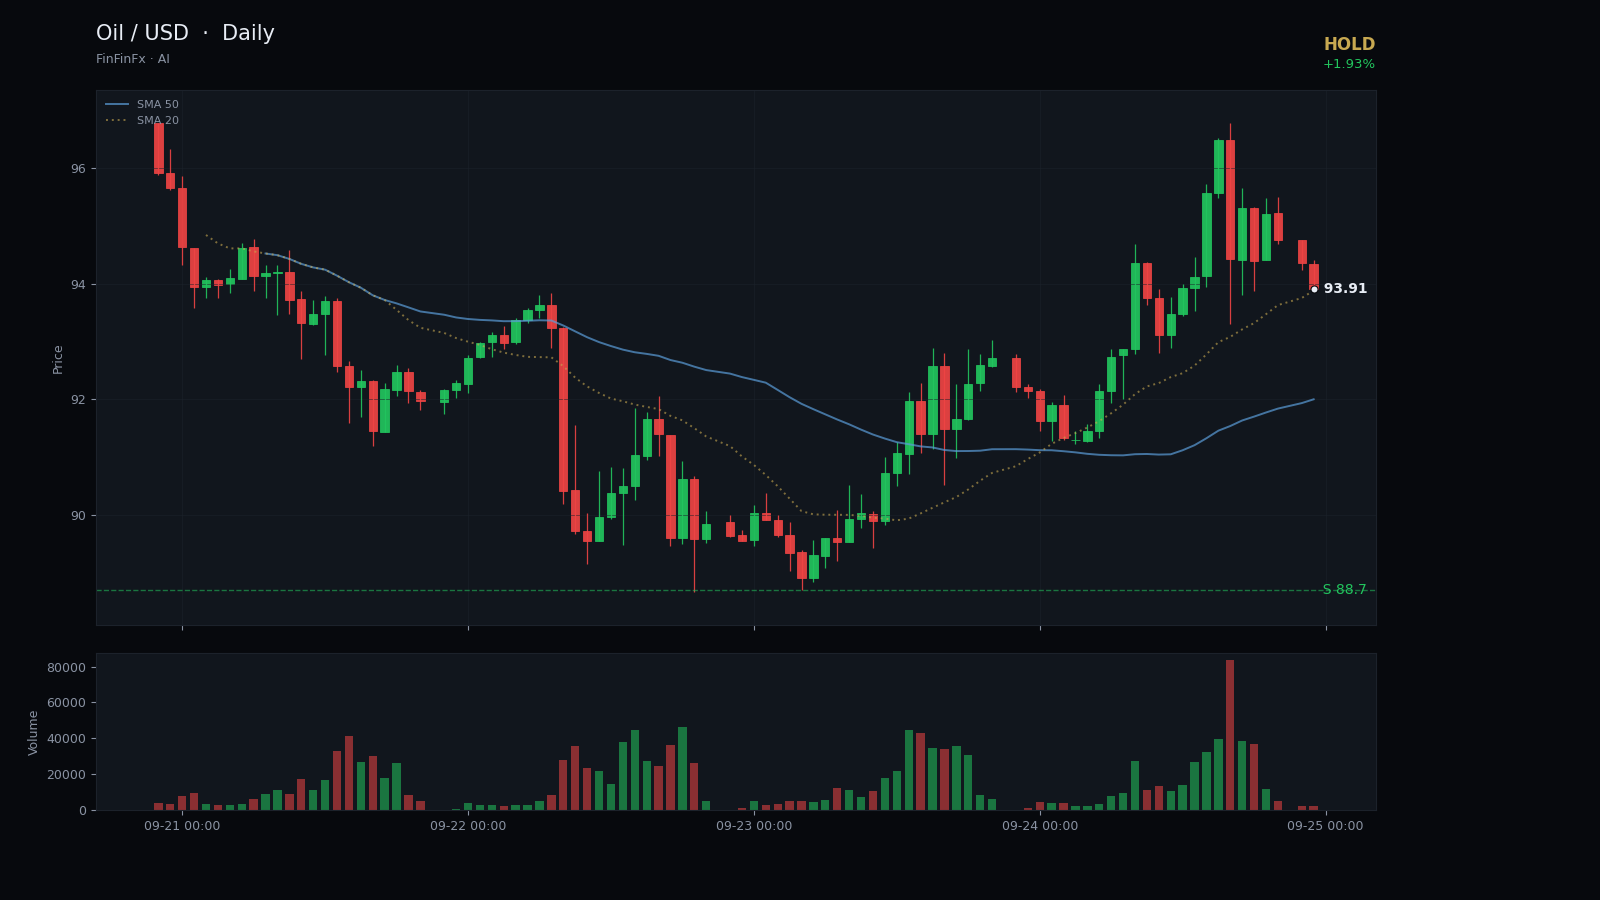
Trendline structure
Volatile retracement from spike high-
Resistance Sep 15 descending resistance
This trendline connects the September 15 spike high at 106.75 with the September 18 swing high at 103.48, defining the upper boundary of the recent selloff channel.
Anchors: 2026-09-15 @ 106.7500 → 2026-09-18 @ 103.4800
-
Support Multi-week support zone
Price found support near 88.70 on both September 4 and September 23, establishing this level as a critical floor for the current consolidation.
Anchors: 2026-09-04 @ 88.7200 → 2026-09-23 @ 88.7100
Oil has delivered a textbook example of volatility over the past two weeks. After climbing steadily from the low 80s through early September, price spiked to 106.75 on September 15—a 20-day high that marked the culmination of a powerful rally. That peak, however, proved unsustainable. Within six sessions, USOIL shed more than 13 dollars, carving out a steep descending channel from the 15th through the 23rd. The selloff found its floor near 88.70 on September 23, a level that has since acted as near-term support. Yesterday's modest 1.93% bounce to 93.94 suggests exhaustion of the immediate downside momentum, but the market has yet to confirm a meaningful reversal.
The trend structure remains ambiguous. The five-day moving average at 95.35 sits above the 20-day at 94.83, a configuration that would ordinarily hint at bullish undertones, yet price is trading below the shorter average and has failed to reclaim it convincingly. RSI at 53.78 is neutral—neither overbought nor oversold—and ATR at 4.94 reflects the recent turbulence. Resistance is clearly defined at 100.30, the September 18 swing high that capped the prior bounce attempt. A daily close above that level would signal renewed buying interest and open the door toward the low 100s. Conversely, support at 88.70 represents the recent low; a break beneath it would likely accelerate selling toward the mid-80s.
Given the current setup, a hold stance is prudent. Entry at 93.94 is reasonable for those already positioned, with a stop-loss at 86.50 to guard against a deeper retracement. The target of 99.50 offers a modest risk-reward profile, though traders should remain alert: a failure to reclaim 95.35 on a closing basis, or a break below 88.70, would invalidate the constructive scenario and warrant re-evaluation. Until price commits to a direction, patience is the higher-probability strategy.
Trade Multi-week support zone and more on a real account — open one in minutes.
Open an account