
Daily Analysis EUR / USD Daily Oversold bounce setup
EUR/USD Oversold at Multi-Week Low, Tactical Bounce Opportunity Emerges
Trendline structure
Oversold bounce setup-
Resistance Sept descending resistance
This trendline connects the 11 September and 18 September highs, forming the upper boundary of the descending channel that has capped all rally attempts.
Anchors: 2026-09-11 @ 1.1620 → 2026-09-18 @ 1.1494
-
Support Channel floor support
Parallel support line running through the 17 September and 24 September lows, marking the lower boundary where buyers have stepped in.
Anchors: 2026-09-17 @ 1.1457 → 2026-09-24 @ 1.1360
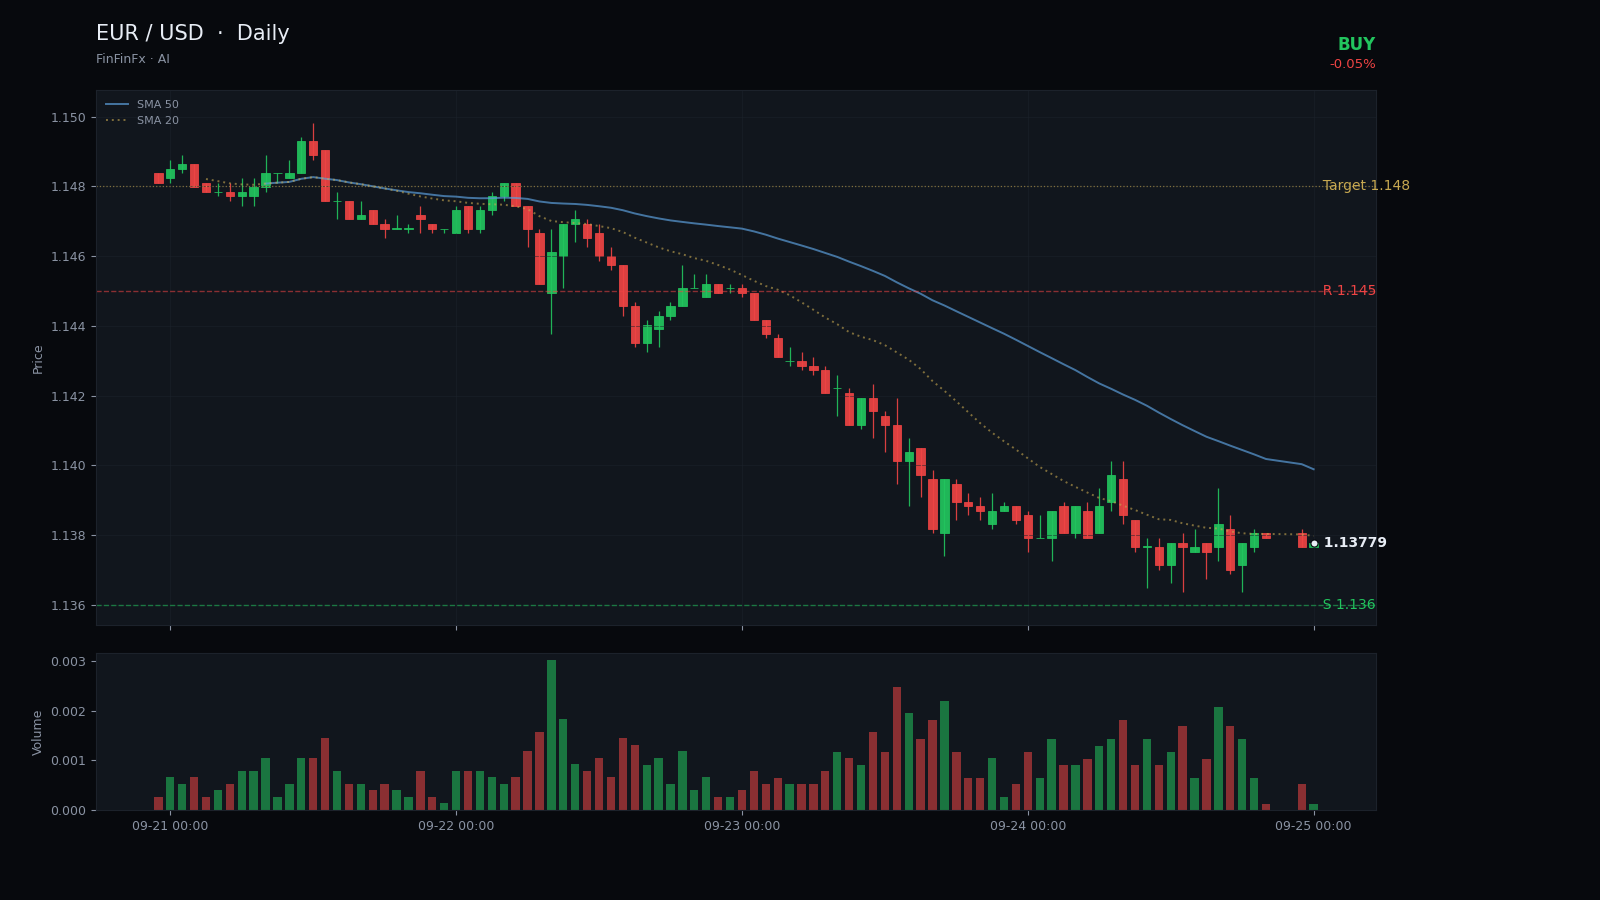
EUR/USD has completed a steep nine-day decline from 1.1653 to the current 1.1377 close, carving out a descending channel that has dominated price action since early September. The upper boundary of this channel connects the 11 September high at 1.1620 and the 18 September peak at 1.1494, forming a clear resistance trendline that has capped every rally attempt over the past two weeks. Meanwhile, the lower boundary runs through the 17 September low at 1.1457 and yesterday's 1.1360 print, establishing a parallel support line that price has now tested and held.
The pair closed Thursday at 1.1377, just 17 pips above the 20-day low of 1.1360, which now serves as primary horizontal support. This level has been tested twice in the past 48 hours and has absorbed selling pressure each time. Resistance sits at 1.1450, a zone that marks the mid-channel mean and aligns with prior consolidation from mid-September. The five-day moving average at 1.1430 and the twenty-day at 1.1545 both slope downward, confirming the prevailing bearish structure, yet the distance between price and these averages suggests the decline has become stretched.
The most compelling feature of this setup is the RSI reading of 10.08, an extreme oversold condition rarely seen on the daily timeframe. Historically, RSI prints below 15 on EUR/USD have preceded short-term bounces, even within established downtrends. The ATR of 0.0051 indicates recent volatility has been elevated, providing room for a mean-reversion move back toward the channel midpoint. We are calling a tactical buy at 1.1377 with a first target of 1.1480, which corresponds to the upper channel line and offers roughly 100 pips of upside. A stop-loss at 1.1330 protects against a breakdown below the 20-day low and limits risk to 47 pips.
This is a counter-trend trade predicated on oversold conditions rather than a trend reversal. The call is invalidated if price closes below 1.1330, as that would signal a breakdown from the channel and likely trigger a deeper leg lower. Traders should also watch for failure to reclaim 1.1450 within three sessions, which would suggest the bounce lacks follow-through and the downtrend remains firmly in control.
Trade Channel floor support and more on a real account — open one in minutes.
Open an account