
Daily Analysis Bitcoin / USD Daily Post-breakout consolidation
Bitcoin Consolidates Near 84K After Sharp Rally, Awaiting Direction
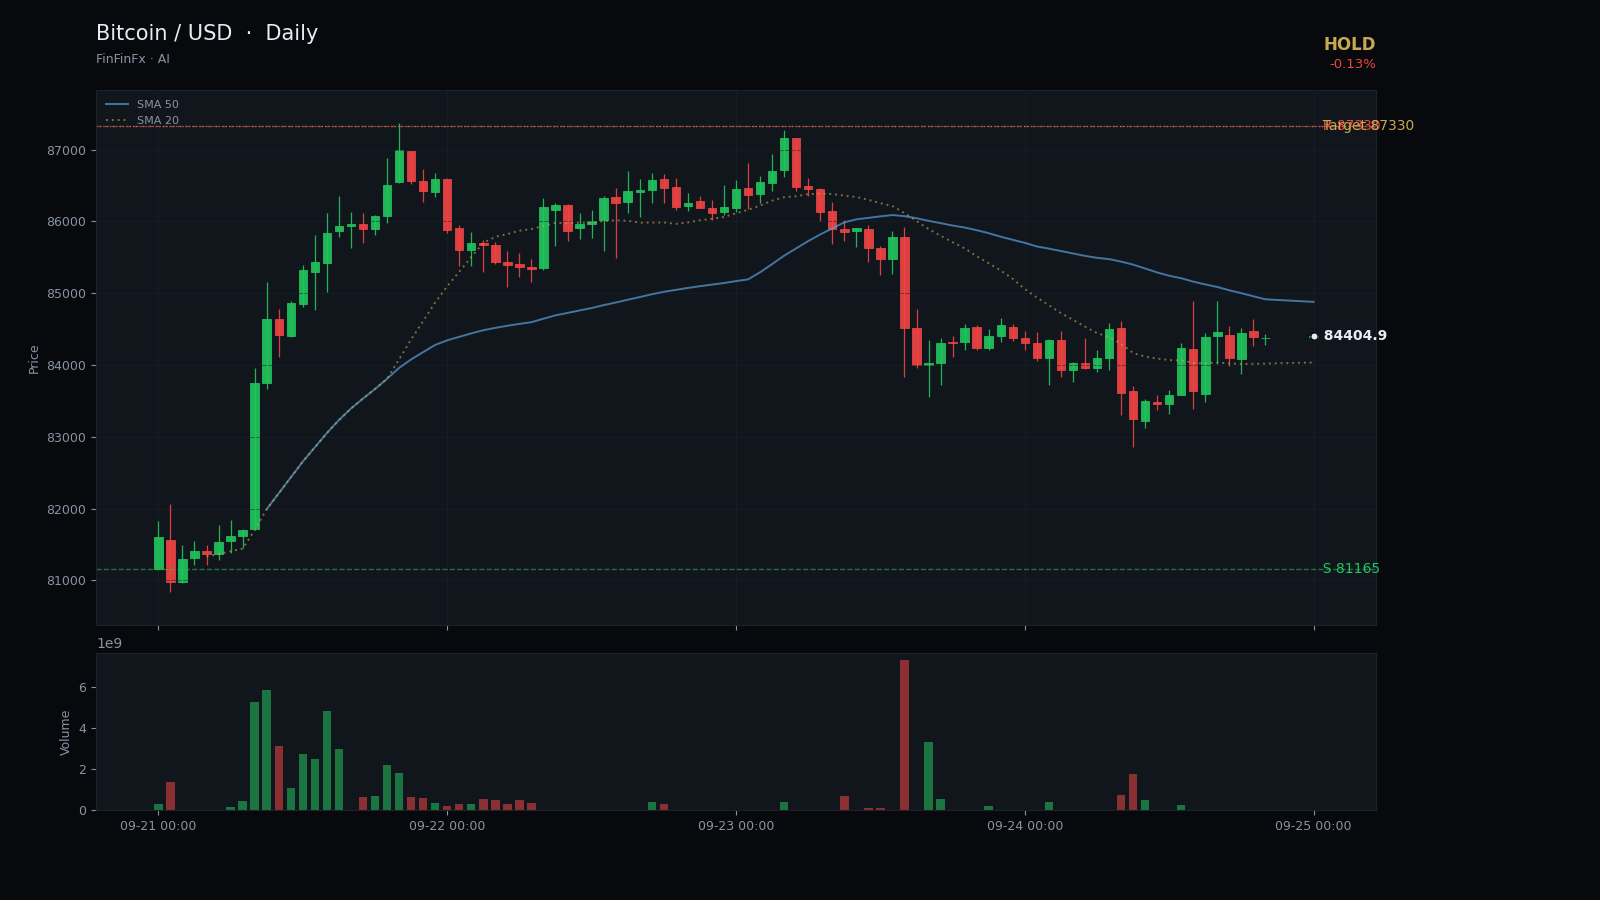
Trendline structure
Post-breakout consolidation-
Support Sep 16 rising support
This trendline connects the September 16 low and the September 20 pivot, defining the floor of the recent rally and currently projecting near 81,165.
Anchors: 2026-09-16 @ 76,015.00 → 2026-09-20 @ 80,155.00
Bitcoin has delivered a powerful rally over the past week, surging from a low near 75,038 on September 15 to a fresh 20-day high of 87,330 on September 22. The move was explosive—a gain of more than 15% in just six sessions—and it has left the market in a consolidation phase. The most important trendline on the chart is the rising support that connects the September 16 low at 76,015 and the September 20 pivot at 80,155. This line has defined the floor of the recent advance and currently projects near 81,165, which also marks the close of September 20 and serves as our primary support zone.
Price is now trading at 84,387, down a modest 0.13% on the day, and sits between the 5-day SMA at 84,560 and the 20-day SMA at 79,863. The short-term average has crossed above the longer-term average, confirming bullish momentum, but the RSI at 69.92 is approaching overbought territory. This reading does not trigger an immediate reversal signal, yet it does suggest that the market may need time to digest recent gains before attempting another leg higher. The ATR of 2,564 reflects elevated volatility, typical after a sharp breakout, and traders should expect continued wide intraday swings.
Resistance is clearly defined at 87,330, the September 22 high. A daily close above that level would reopen upside potential and likely attract fresh buying interest. Until then, we are in a post-breakout consolidation pattern, and the prudent stance is to hold existing positions rather than chase price at current levels. Support at 81,165 is critical; a break below would shift the near-term structure and raise the risk of a deeper pullback toward the 20-day SMA near 79,863. Our stop-loss is set at 80,150, just beneath the rising trendline and the September 20 low, to protect against a breakdown that would invalidate the bullish setup.
The call is to hold and monitor. If you are long, maintain your position with a stop at 80,150 and a target at 87,330. If you are flat, wait for either a breakout above resistance or a pullback to support before committing capital. The pattern remains constructive, but the elevated RSI and recent volatility argue for patience. A daily close below 80,150 would be the clearest sign that the rally has stalled and that a period of deeper consolidation or correction is underway.
Trade Sep 16 rising support and more on a real account — open one in minutes.
Open an account