
Daily Analysis EUR / USD Daily Oversold bounce setup
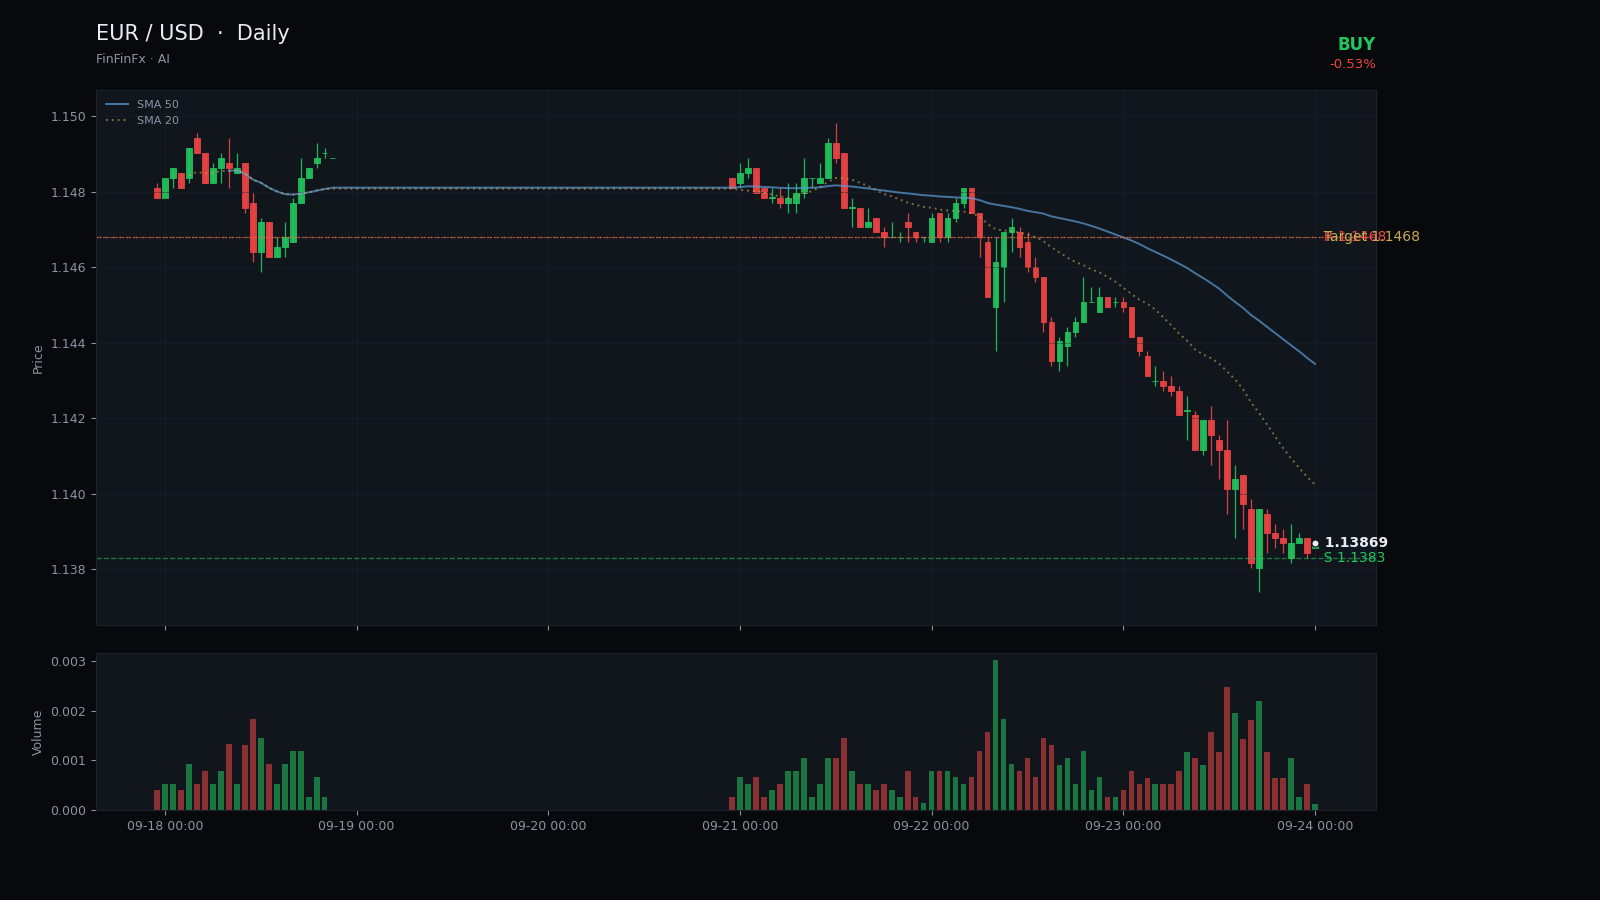
EUR/USD Oversold Bounce Setup After Sharp Decline to 1.1387
Trendline structure
Oversold bounce setup-
Resistance Aug 21 descending resistance
This trendline connects the August 21 high and September 4 peak, defining the upper boundary of the month-long downtrend channel.
Anchors: 2026-08-21 @ 1.1712 → 2026-09-04 @ 1.1633
-
Support Sep 14 accelerating support
This steeper support line traces the accelerated decline from mid-September lows, marking the lower edge of the recent selloff.
Anchors: 2026-09-14 @ 1.1524 → 2026-09-24 @ 1.1383
EUR/USD has entered deeply oversold territory following a sustained decline that began in late August. The pair closed at 1.1387 on September 24, down 0.53% on the day and marking a fresh 20-day low at 1.1383. The descending resistance trendline connecting the August 21 high at 1.1712 and the September 4 peak at 1.1633 has capped every rally attempt over the past month, defining a clear downtrend channel. Price has respected this line through at least five touches, and the most recent rejection on September 11 preceded the sharpest leg of the selloff.
The RSI14 reading of 9.96 is exceptionally low—well into single-digit territory that historically precedes short-term mean reversion. While momentum remains firmly negative and both the SMA5 at 1.1451 and SMA20 at 1.1560 sit well above current price, such extreme RSI levels often exhaust selling pressure temporarily. The 20-day low at 1.1383 now serves as immediate support, a level tested intraday on September 24. Above, initial resistance lies at 1.1468, roughly the mid-September consolidation zone and a logical first target for any bounce.
The tactical call is a cautious buy at 1.1387, targeting 1.1468 with a stop-loss at 1.1350. This oversold bounce setup relies on short-term exhaustion rather than trend reversal. ATR14 at 0.0051 suggests daily volatility near 51 pips, so the 37-pip stop provides reasonable breathing room. A break below 1.1350 would signal that sellers remain in full control and that the downtrend channel is extending lower. This is a counter-trend trade; risk management is essential, and traders should watch for any failure to reclaim 1.1420 as a sign to exit early.
Trade Sep 14 accelerating support and more on a real account — open one in minutes.
Open an account