
Daily Analysis Bitcoin / USD Daily Parabolic rally pullback
Bitcoin Consolidates After Parabolic Rally, Holding Above Key Support Zone
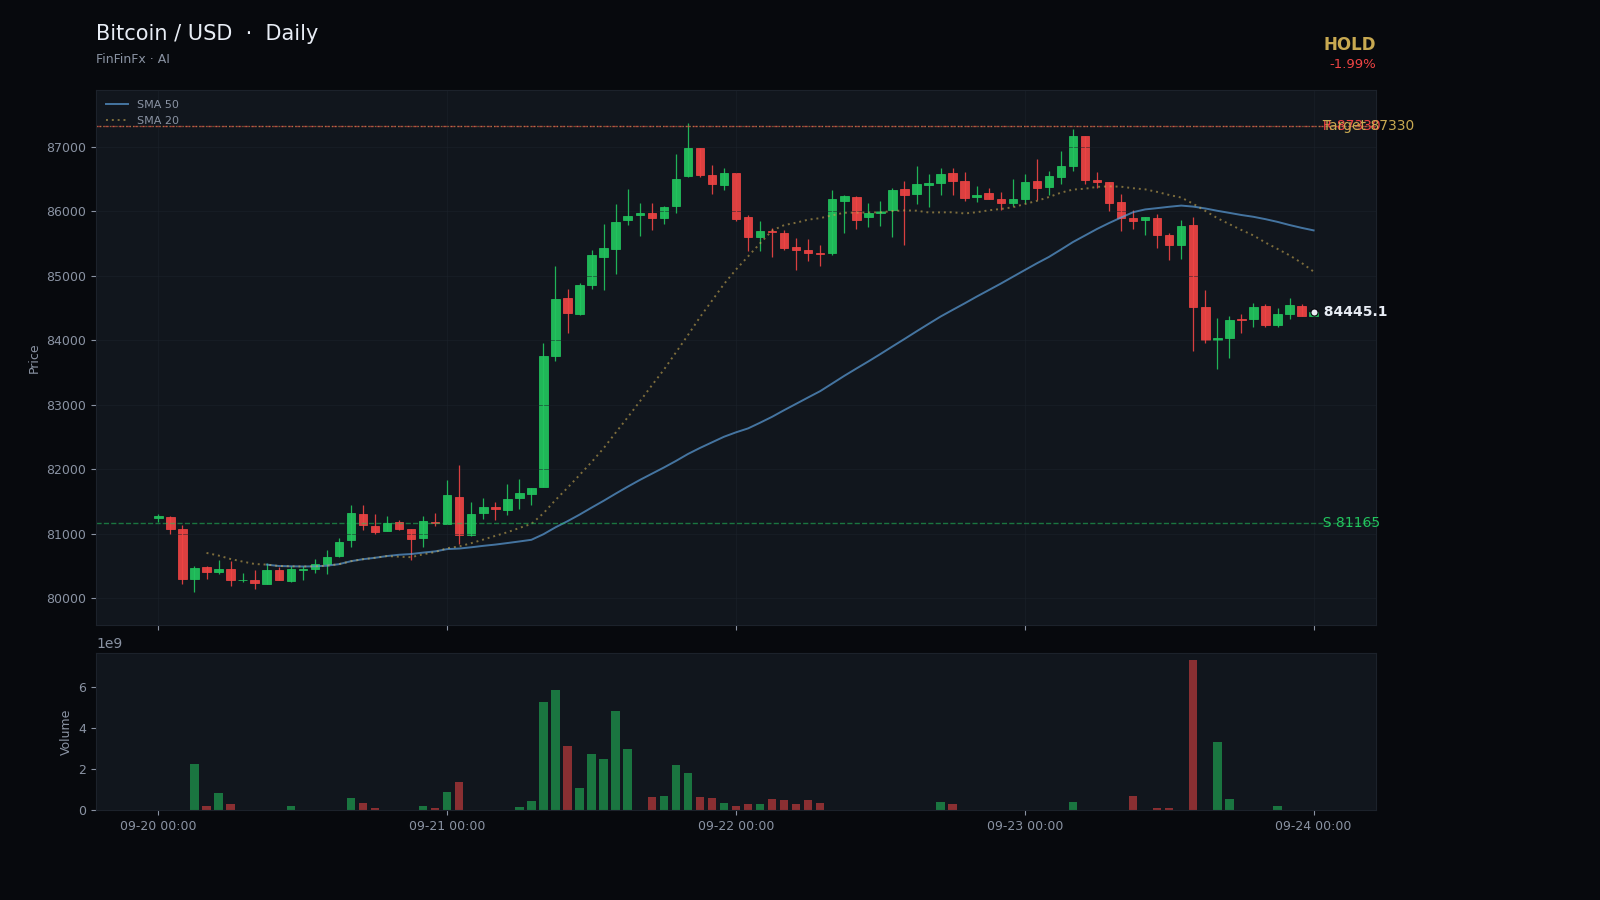
Trendline structure
Parabolic rally pullback-
Support Sep 17 rising support
This ascending trendline connects the September 17 swing low and the September 20 pullback, guiding the parabolic rally and currently projecting near 81,165.
Anchors: 2026-09-17 @ 75,602.00 → 2026-09-20 @ 80,155.00
-
Resistance Recent rally ceiling
A short-term resistance zone formed by the September 21–22 highs, marking the upper boundary of the parabolic move and the breakout threshold.
Anchors: 2026-09-21 @ 86,838.00 → 2026-09-22 @ 87,330.00
Bitcoin has traced a powerful parabolic rally over the past week, surging from a 20-day low of 75,038 on September 15 to a fresh high of 87,330 on September 22. The move gained momentum on September 18 when price broke decisively above the 77,000–78,000 consolidation zone, then accelerated through September 21 with a single-day gain of more than 5,300 points. That explosive candle established a rising support trendline connecting the September 17 low at 75,602 and the September 20 pullback low at 80,155, a line that has guided the rally and now sits near 81,165.
Yesterday's close at 84,493 marks a 1.99% decline and the first meaningful pause after three consecutive days above 86,000. The pullback has respected the rising support so far, and the 5-day moving average at 83,946 is converging with current price, suggesting short-term equilibrium. RSI stands at 66, elevated but not yet overbought, leaving room for another leg higher if buyers return. ATR has expanded to 2,555, reflecting the recent volatility and indicating that swings of this magnitude are now normal.
Resistance is clearly defined at 87,330, the September 22 high and the upper boundary of this parabolic structure. A daily close above that level would confirm continuation and open the door to further gains. Support rests at 81,165, the September 20 swing low and the anchor of the rising trendline; a break below would signal that the rally has exhausted and invite a deeper correction toward the 20-day moving average near 79,633 or even the mid-September lows around 76,000.
Given the strength of the recent move and the current pullback's shallow nature, a hold stance is appropriate. Traders should wait for either a decisive breakout above 87,330 or a breakdown below 81,165 before committing fresh capital. The pattern remains constructive as long as price holds above the rising support, but the steep angle of the rally warrants caution. A stop below 80,150 would protect against a deeper unwind, while a target at 87,330 offers a measured reward if the uptrend resumes.
Trade Recent rally ceiling and more on a real account — open one in minutes.
Open an account