
Daily Analysis Oil / USD Daily Failed breakout reversal
Oil Plunges 6.4% After Failed Breakout – Bearish Reversal Underway
Trendline structure
Failed breakout reversal-
Support Aug–Sep rising support (broken)
This ascending trendline supported the rally from late August through early September but was decisively broken on September 21.
Anchors: 2026-08-26 @ 79.6200 → 2026-09-08 @ 90.8700
-
Resistance Sep spike resistance zone
The September 10–15 highs between $104 and $106.75 mark the exhaustion zone where the rally failed and reversed.
Anchors: 2026-09-10 @ 104.0400 → 2026-09-15 @ 106.7500
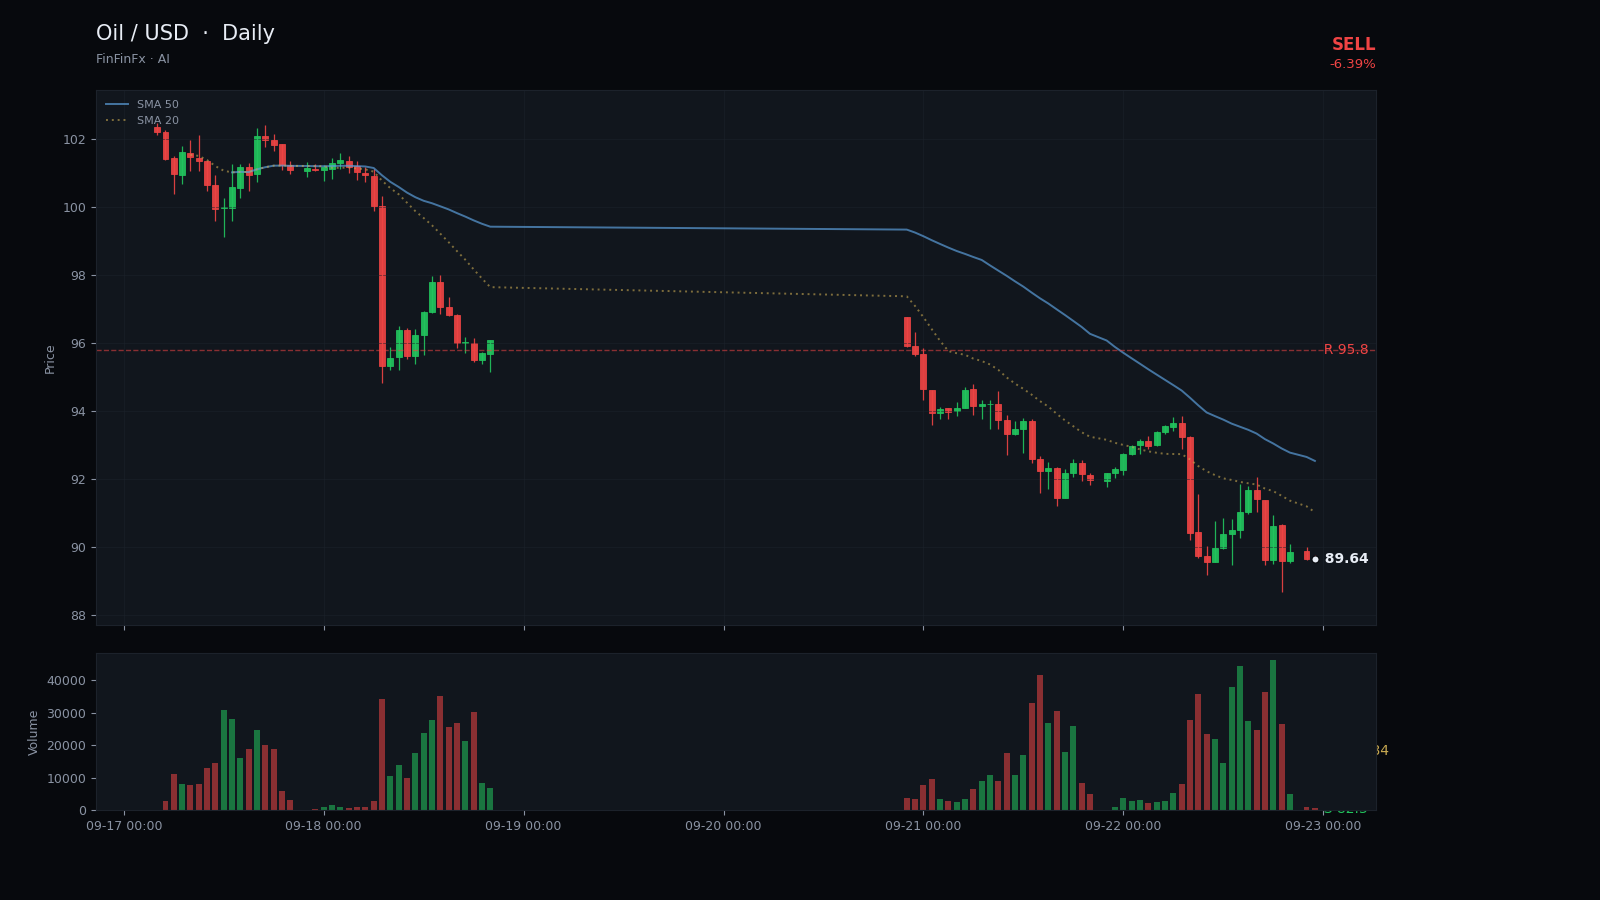
Oil has printed a sharp reversal after a brief but violent rally collapsed. From August 11 through September 15, price climbed from the low $80s to a peak of $106.75, tracing an aggressive ascending channel. The lower boundary of that channel, connecting the August 26 low at $79.62 and the September 8 swing low near $90.87, provided consistent support through the rally phase. However, the September 15 spike to $106.75 marked an exhaustion point; price has since broken down through that rising support line and accelerated lower.
The failed breakout reversal is now the dominant pattern. After touching the 20-day high at $106.75, Oil reversed sharply and closed yesterday at $89.66, a single-session drop of 6.39%. This move has taken price below the five-day moving average at $98.02 and is now testing the psychological zone around $90. The 20-day moving average at $93.51 sits just overhead and is likely to act as near-term resistance on any bounce attempt. Primary resistance is marked at $95.80, the September 21 intraday low that now caps the breakdown zone. On the downside, horizontal support rests at $82.30, a cluster formed by late-August lows and the August 25–27 consolidation area.
The RSI at 49.24 has rolled over from overbought territory and is now neutral, confirming momentum has shifted but not yet oversold. The ATR reading of 4.91 reflects elevated volatility, typical of a sharp reversal phase. Given the breakdown through rising support and the failure to hold above $95, the bias is now bearish. A sell signal is warranted with entry at the current close of $89.66, targeting a move toward $84.00, which aligns with the lower end of the August range and offers a logical downside objective. A stop-loss at $93.50 protects against a swift recovery above the 20-day SMA and the breakdown zone. This setup is invalidated if price reclaims $95.80 and closes above it, signaling that buyers have regained control and the failed breakout was merely a shakeout rather than a true reversal.
Trade Sep spike resistance zone and more on a real account — open one in minutes.
Open an account