
Daily Analysis Bitcoin / USD Daily Parabolic rally exhaustion
Bitcoin Pauses Near All-Time High After Explosive Rally to 87K
Trendline structure
Parabolic rally exhaustion-
Support Mid-Sep rising support
This ascending trendline connects the September 16 and 18 lows, capturing the initial breakout phase before the vertical rally.
Anchors: 2026-09-16 @ 75,151.00 → 2026-09-18 @ 76,205.00
-
Resistance Recent rally ceiling
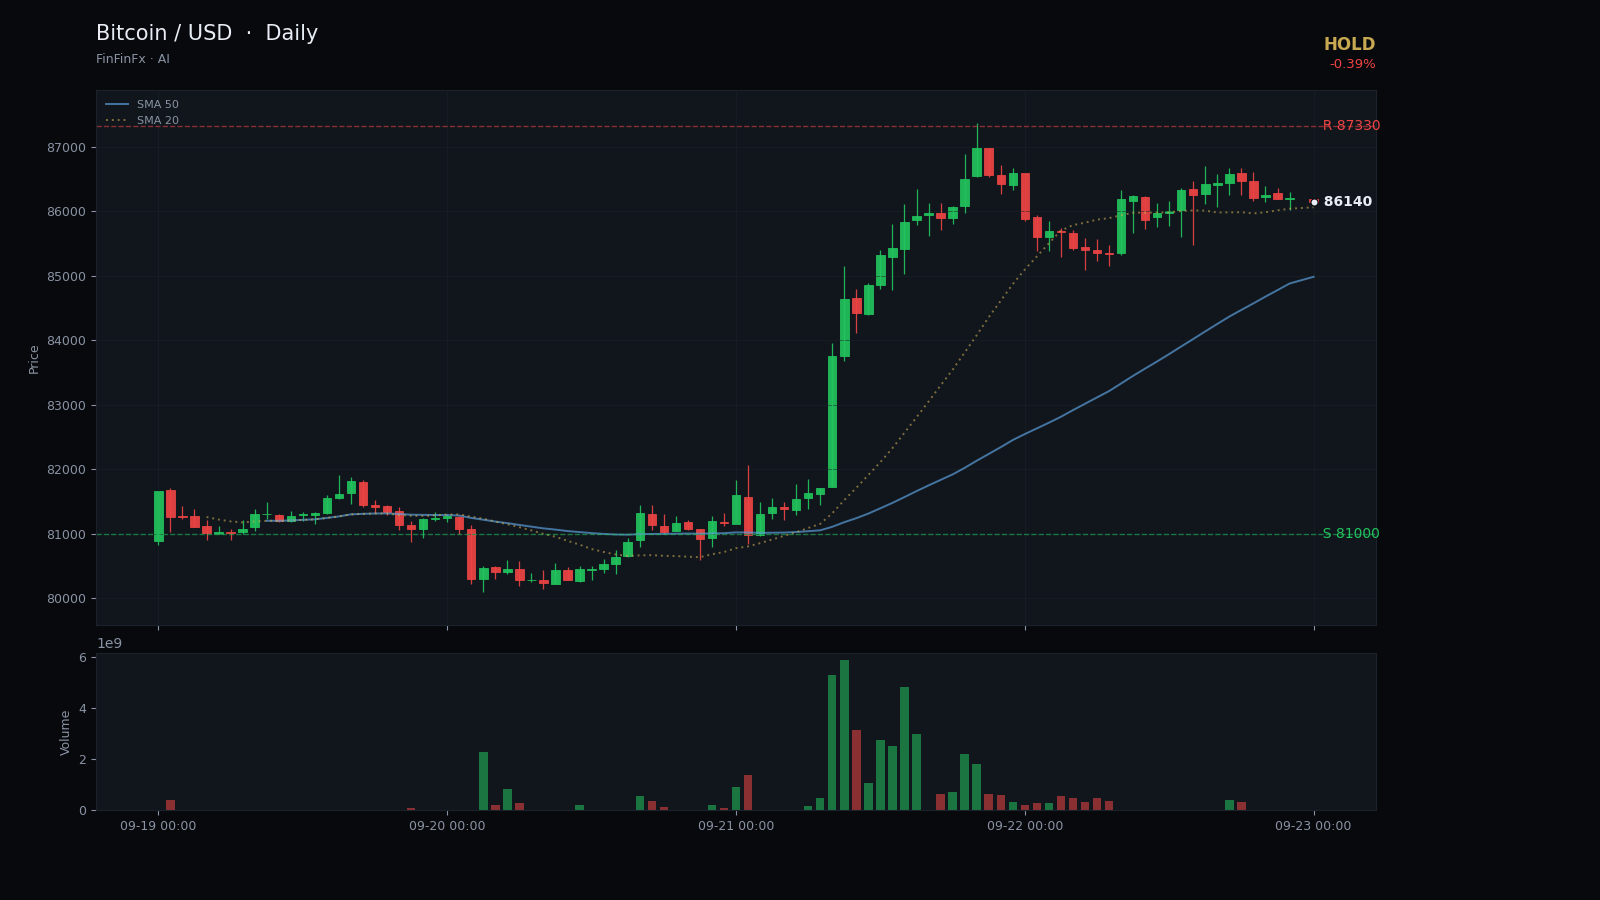
Horizontal resistance formed by the September 21-22 highs, marking the upper boundary of the current consolidation zone.
Anchors: 2026-09-21 @ 86,838.00 → 2026-09-22 @ 87,330.00
Bitcoin has entered a consolidation phase after one of its most dramatic single-session rallies in recent months. On September 21, price exploded from the 81,169 open to an intraday high of 86,838—a gain of nearly 7,000 dollars—before settling at 86,545. The following session printed a high of 87,330, establishing the current 20-day peak, then pulled back modestly to close at 86,210. This parabolic rally exhaustion pattern is now unfolding as momentum cools.
The trend structure reveals a sharp recovery from mid-September lows. After touching 75,038 on September 15, Bitcoin carved a series of higher lows through September 16–18, forming an ascending support line that connects 75,151 on the 16th to 76,205 on the 18th. This rising support captured the initial phase of the breakout and has since been left behind by the vertical move. Price now trades well above both the 5-day SMA at 83,286 and the 20-day SMA at 79,496, confirming short-term bullish structure. However, the 14-period RSI has climbed to 72.11, entering overbought territory and suggesting limited immediate upside without a pullback or rest period.
Key resistance sits at the September 22 high of 87,330, a level that has capped the rally twice in the past two sessions. Immediate support is found at the psychological 81,000 zone, which aligns with the September 18–20 breakout cluster and the recent swing low at 80,631. A daily close below 81,000 would signal that the breakout is losing conviction and open the door to a deeper retracement toward the 20-day moving average near 79,500.
Given the overbought RSI and the lack of a clear continuation pattern, the prudent stance is to hold and wait for either a healthy pullback to the 84,500 area or a decisive breakout above 87,330 on strong volume. Entry at 84,500 offers a better risk-reward profile, with a stop-loss at 79,500 protecting against a full reversal of the breakout. The target price of 89,500 assumes a measured move extension if resistance is cleared. This call is invalidated if Bitcoin closes below 79,500, which would break the rising 20-day average and suggest the rally was a false breakout rather than the start of a new leg higher.
Trade Recent rally ceiling and more on a real account — open one in minutes.
Open an account