
Daily Analysis Oil / USD Daily Overbought pullback from spike
Oil Pulls Back After Spike Rally; Overbought RSI Warns of Consolidation Risk
Trendline structure
Overbought pullback from spike-
Support Aug 26 rising support
This ascending trendline has guided the rally from late August lows, connecting four swing lows and defining the bullish structure.
Anchors: 2026-08-26 @ 79.6200 → 2026-09-08 @ 90.8700
-
Resistance Sep spike resistance zone
This resistance zone marks the parabolic spike highs from the 10-15 September rally, capping recent attempts to extend gains.
Anchors: 2026-09-10 @ 104.0400 → 2026-09-15 @ 106.7500
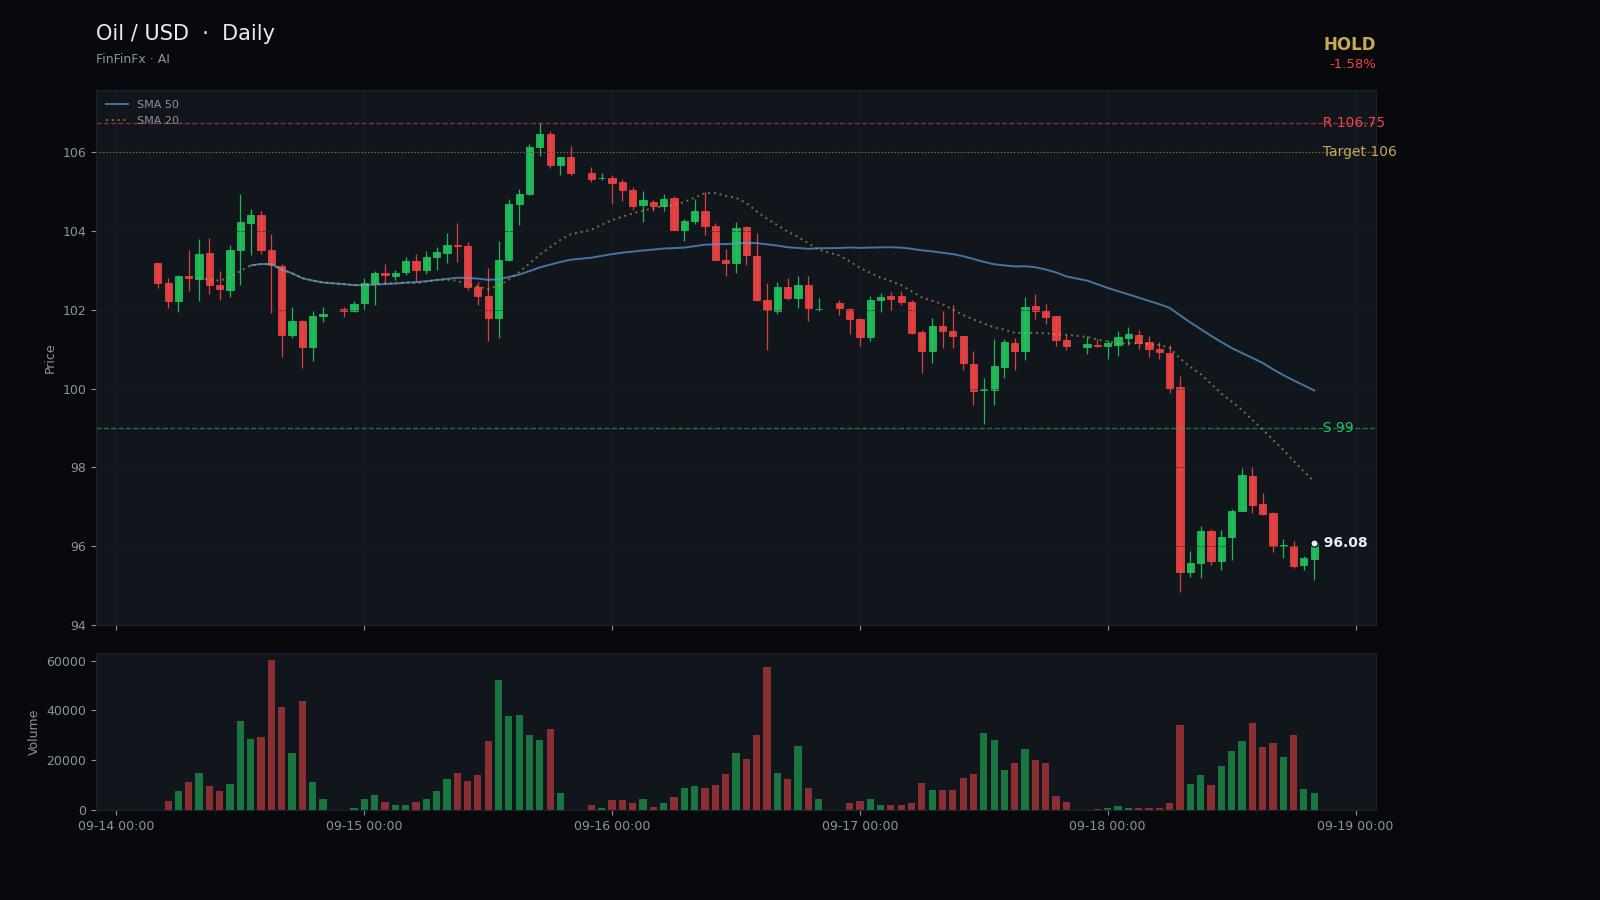
Oil has traced a powerful upward trajectory since late August, climbing from the $79.62 low on 26 August through a series of higher lows that define a rising support trendline. This line, anchored at the 26 August swing low and the 8 September pivot near $90.87, has guided the rally through nearly three weeks of sustained buying pressure. Price respected this support on four separate occasions, each time bouncing higher and confirming the bullish structure. The most dramatic move came on 10 September, when Oil gapped through $100 and surged to $104.04 intraday, eventually peaking at $106.75 on 15 September.
That $106.75 print now stands as the primary resistance and the 20-day high. Since touching that level, price has pulled back across three consecutive sessions, closing today at $100.30—a decline of 1.58% and the third lower close in a row. The five-day moving average at $102.37 still sits well above the 20-day SMA at $92.84, confirming the medium-term uptrend remains intact. However, the RSI14 reading of 75.75 signals deeply overbought conditions, the highest level in this entire rally. Meanwhile, the 14-day ATR of $4.59 reflects elevated volatility, typical of a market that has moved too far too fast.
Key horizontal support now lies at $99.00, a round psychological figure just below today's close and near the 17 September low of $99.10. A break below $99 would likely trigger stops and open the door to a deeper retracement toward the $96–97 zone, where the rising trendline currently projects. Resistance remains firm at $106.75; any reclaim of that level would signal renewed momentum and potentially extend the rally toward $110.
Given the overbought RSI, the recent three-day pullback, and the lack of a clear re-entry setup, the prudent stance is to hold and wait for either a successful test of $99 support or a decisive breakout above $106.75. A stop-loss below $96.50 protects against a breakdown of the rising trendline, while a target near $106 offers a reasonable reward if the uptrend resumes. This call is invalidated if price closes below $96.50, breaking both the trendline and the recent consolidation base, or if RSI fails to cool and price continues to churn sideways, signaling distribution rather than healthy consolidation.
Trade Sep spike resistance zone and more on a real account — open one in minutes.
Open an account