
Daily Analysis Gold / USD Daily Descending channel retest
Gold Tests Falling Channel Resistance After Sharp August Decline
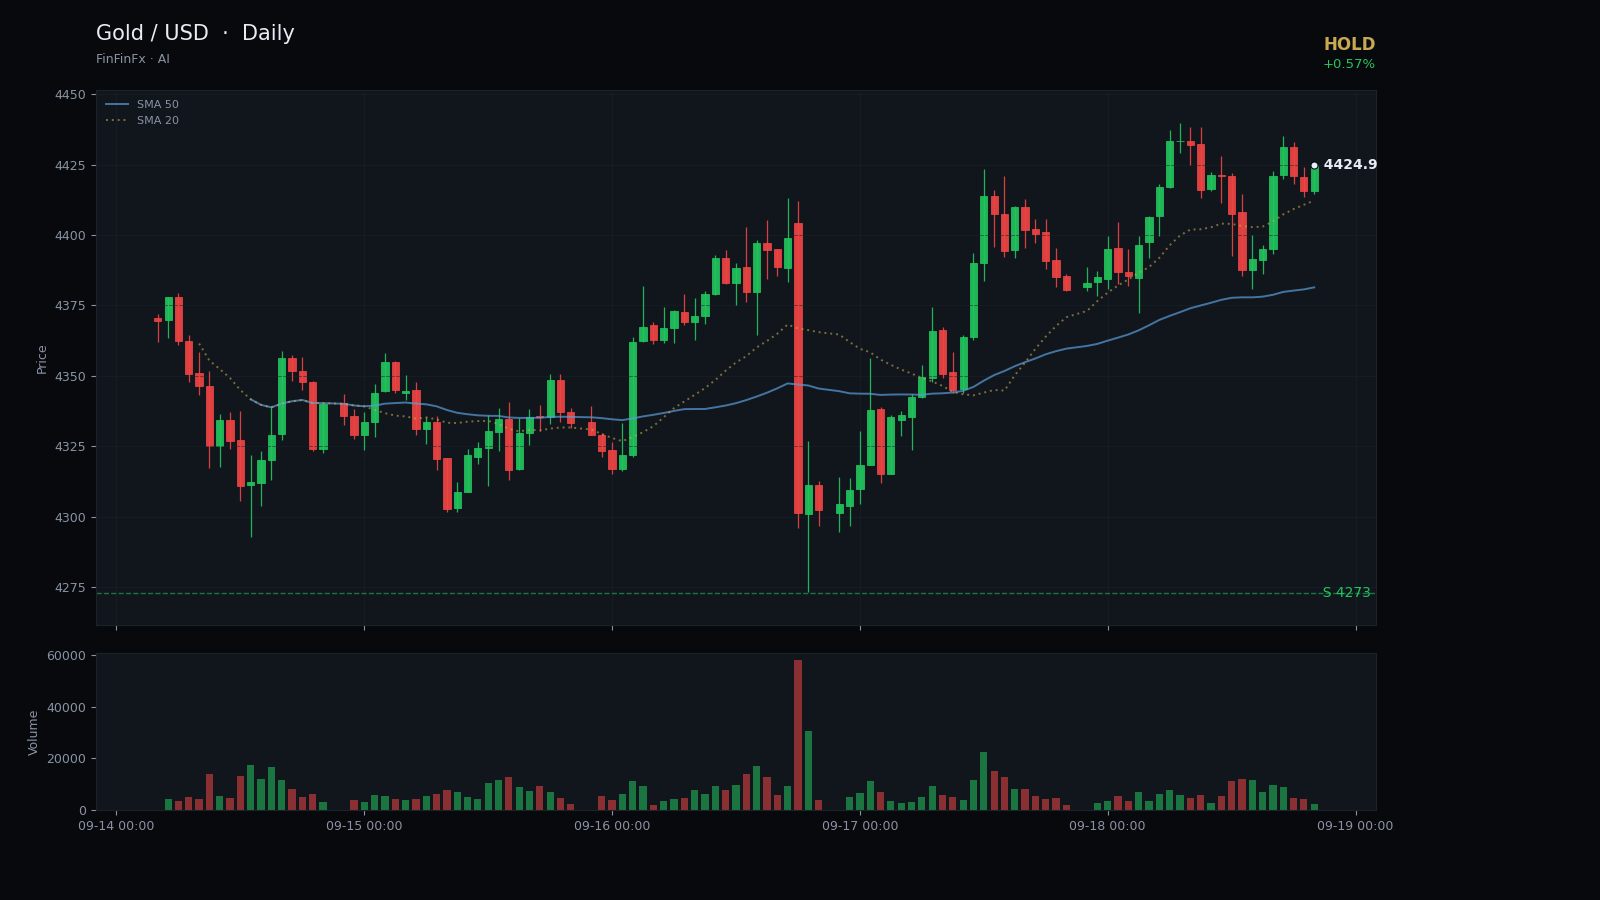
Trendline structure
Descending channel retest-
Resistance Aug 25 descending resistance
This resistance trendline connects the August peak at 4755 with the September high at 4558, defining the upper boundary of the descending channel.
Anchors: 2026-08-25 @ 4,755.00 → 2026-09-03 @ 4,558.00
-
Support Parallel channel support
This support line runs parallel to the descending resistance, anchored at the 31 August and 16 September lows, forming the lower channel boundary.
Anchors: 2026-08-31 @ 4,446.00 → 2026-09-16 @ 4,273.00
Gold has carved out a clear descending channel since late August, defined by a resistance trendline connecting the 25 August high at 4755 and the 3 September peak at 4558. Price has respected this downward slope through three distinct tests, most recently on 17 September when the market failed to hold above 4423. The parallel support line, anchored at the 31 August low of 4446 and the 16 September bottom at 4273, has contained the selling pressure and provided a floor for the current bounce. This channel structure, now three weeks old, frames a market in controlled retreat from the late-August highs.
The 20-day range of 4755 to 4273 captures the full scope of this decline, a 482-point swing that underscores the volatility embedded in this move. The SMA5 at 4379 sits well below the SMA20 at 4492, confirming bearish momentum remains intact despite the two-day bounce off the channel floor. RSI14 at 41.57 has lifted from oversold territory but remains below the neutral 50 threshold, signaling that buyers have not yet reclaimed control. ATR14 at 111 reflects the elevated intraday swings typical of a market searching for direction within a defined range.
Today's close at 4425 places gold in the middle of the channel, equidistant from both boundaries. Immediate resistance sits at 4540, the 3 September high and the upper edge of recent consolidation. A sustained break above that level, confirmed by a daily close, would challenge the descending channel resistance near 4560 and open the door toward 4600. Primary support rests at 4273, the 16 September low and the lower channel boundary. A break below 4240 would invalidate the channel structure and likely accelerate selling toward 4200.
The descending channel retest pattern suggests caution rather than conviction. While the bounce off 4273 shows buyers are willing to defend the lower boundary, the failure to reclaim the SMA5 and the weak RSI reading argue against aggressive positioning. A hold stance is warranted until price either breaks cleanly above 4540 with expanding volume or violates 4240, forcing a reassessment of the channel's validity. Risk remains elevated, and traders should wait for a clearer directional signal before committing capital.
Trade Parallel channel support and more on a real account — open one in minutes.
Open an account