
Daily Analysis EUR / USD Daily Range-bound consolidation
EUR/USD Consolidates Near Mid-Range as Directional Conviction Remains Absent
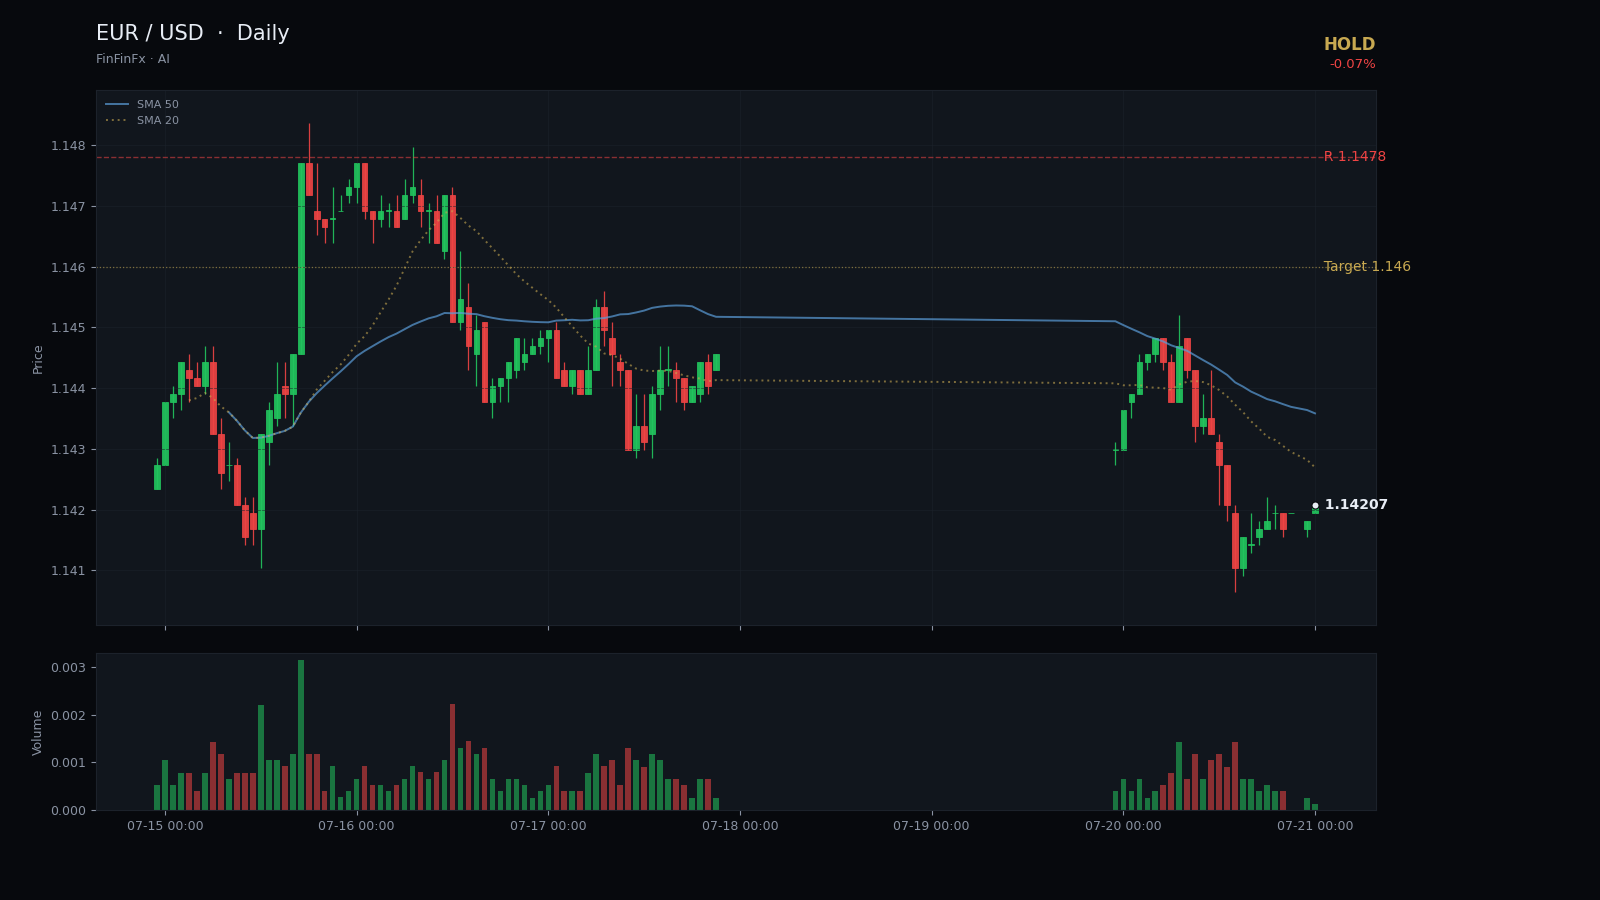
Trendline structure
Range-bound consolidation-
Support Rising support since late June
This ascending trendline connects the 24 June and 14 July lows, providing a floor that has held four tests over three weeks.
Anchors: 2026-06-24 @ 1.1325 → 2026-07-14 @ 1.1378
-
Resistance Descending resistance from June
This declining trendline links the 17 June and 16 July highs, capping every rally and forming the upper boundary of the compression pattern.
Anchors: 2026-06-17 @ 1.1610 → 2026-07-16 @ 1.1478
EUR/USD has spent the past three weeks carving out a range-bound consolidation between 1.1325 and 1.1478, with neither bulls nor bears able to claim control. The pair closed Tuesday at 1.1419, down a modest 0.07 percent, sitting almost exactly at the midpoint of this 153-pip range. The five-day moving average at 1.1437 has crossed above the twenty-day at 1.1412, but the margin is too thin to signal a meaningful trend shift, and RSI14 rests at 51—textbook neutral territory.
The trend structure reveals two parallel boundaries that have contained price action since late June. A rising support trendline connects the 24 June low at 1.1325 and the 14 July low at 1.1378, climbing at roughly 25 pips per week. This line has been tested four times and has held on each occasion, most recently on 20 July when price dipped to 1.1405 intraday before bouncing. Above, a descending resistance trendline links the 17 June high at 1.1619 and the 16 July peak at 1.1478, capping every rally attempt over the past month. Together, these lines form a symmetrical compression pattern, with the distance between them narrowing by approximately 140 pips over four weeks.
Key horizontal levels reinforce the channel boundaries. Support at 1.1325 marks the 24 June swing low and the lower edge of the twenty-day range; a daily close beneath it would open the door toward 1.1290 and potentially 1.1260. Resistance at 1.1478 represents the 16 July high and the upper range limit; a sustained break above would target 1.1520 and then the mid-June highs near 1.1600. The fourteen-day ATR of 0.0053 (53 pips) suggests intraday volatility remains moderate, giving swing traders room to work but requiring patience for a clear directional signal.
Given the lack of momentum and the tightening range, the prudent stance is to hold and wait for a confirmed breakout. A buy entry near 1.1419 could be considered if price holds above 1.1400 and RSI pushes above 55, targeting 1.1460 initially with a stop below 1.1290. Conversely, a breakdown below 1.1325 on rising volume would justify a short bias. Until one of these boundaries gives way, the pattern remains a coin-flip, and forcing a trade inside this compression carries more risk than reward.
Trade Descending resistance from June and more on a real account — open one in minutes.
Open an account