
Daily Analysis Oil / USD Daily Overbought rally near resistance
USOIL Tests 84.60 Resistance After Sharp Rally, RSI Warns Overbought
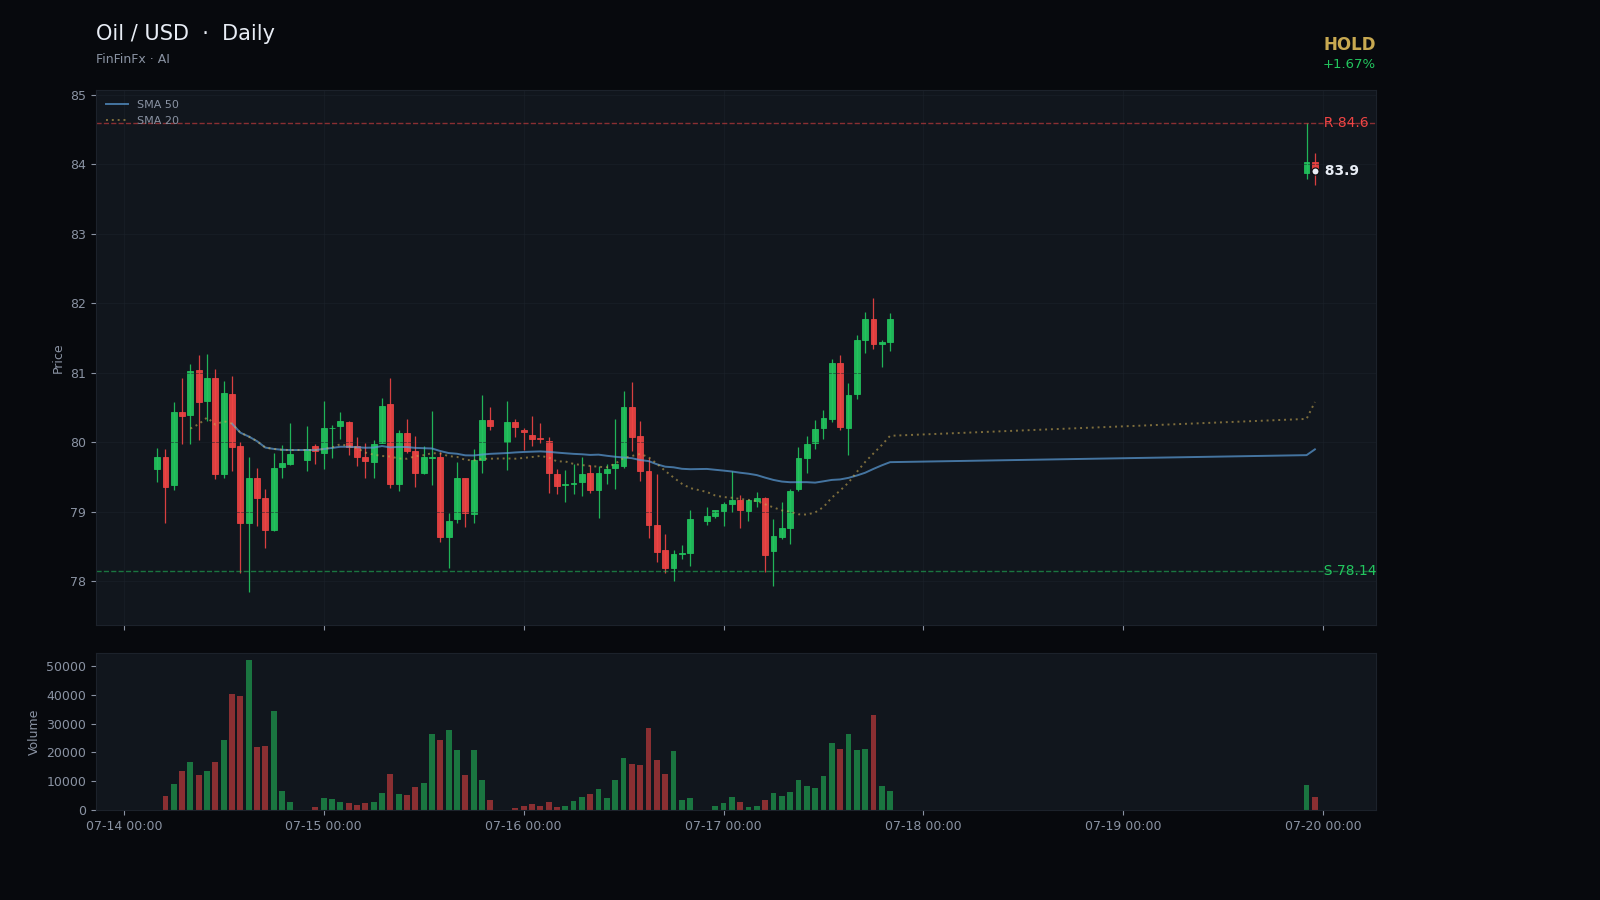
Trendline structure
Overbought rally near resistance-
Support Jun 24 rising support
This ascending trendline has guided the entire recovery from the June lows, with price respecting it through multiple tests during the rally phase.
Anchors: 2026-06-24 @ 70.3400 → 2026-07-10 @ 71.4100
-
Resistance Jul 16 resistance ceiling
This short-term resistance line connects recent swing highs and marks the upper boundary where momentum has stalled twice in the past week.
Anchors: 2026-07-16 @ 80.8700 → 2026-07-19 @ 84.6000
Oil has staged an impressive recovery from the 67.04 low printed on July 2, climbing more than 25% in just twelve trading sessions to reach 83.87. This sharp move has pushed price into a critical zone where momentum meets technical resistance, creating a setup that demands caution rather than chase.
The rally structure is defined by an ascending support trendline connecting the June 24 low at 70.34 and the July 10 swing low at 71.41. This line has guided the entire recovery phase, with price respecting it through multiple intraday tests. The angle is steep—roughly 45 degrees—which historically signals unsustainable momentum in commodity markets. Meanwhile, the 20-day high at 84.60 has emerged as the immediate resistance ceiling, a level that has capped upside twice in the past week.
The overbought rally near resistance pattern is confirmed by an RSI reading of 78.20, well into territory where prior rallies have stalled or reversed. The 5-day SMA at 80.85 has crossed decisively above the 20-day SMA at 73.77, a bullish configuration, but the vertical distance between them suggests the move has stretched too far, too fast. ATR at 3.24 reflects elevated volatility, meaning any reversal could be swift.
Support now sits at 78.14, the July 13 breakout pivot that launched the current leg higher. This level aligns with the rising trendline and represents the first line of defense. Resistance remains 84.60, the 20-day high and a logical profit-taking zone for longs established near 70.
The call here is hold. If you are not already long, this is not an entry point—RSI extremes and proximity to resistance argue against fresh buying. Existing longs should consider scaling out near 84.60 or tightening stops to 76.50, just below the prior consolidation base. A break above 84.60 on strong volume would open the door to 87.50, but that scenario requires confirmation. Conversely, a daily close below 78.14 would invalidate the bullish structure and likely trigger a retest of the 73–74 zone, erasing much of the recent gain. The risk-reward at current levels does not favor aggressive positioning in either direction.
Trade Jul 16 resistance ceiling and more on a real account — open one in minutes.
Open an account