
Daily Analysis Gold / USD Daily Descending channel consolidation
Gold Trades Near Channel Support, Awaiting Directional Catalyst Below 4000
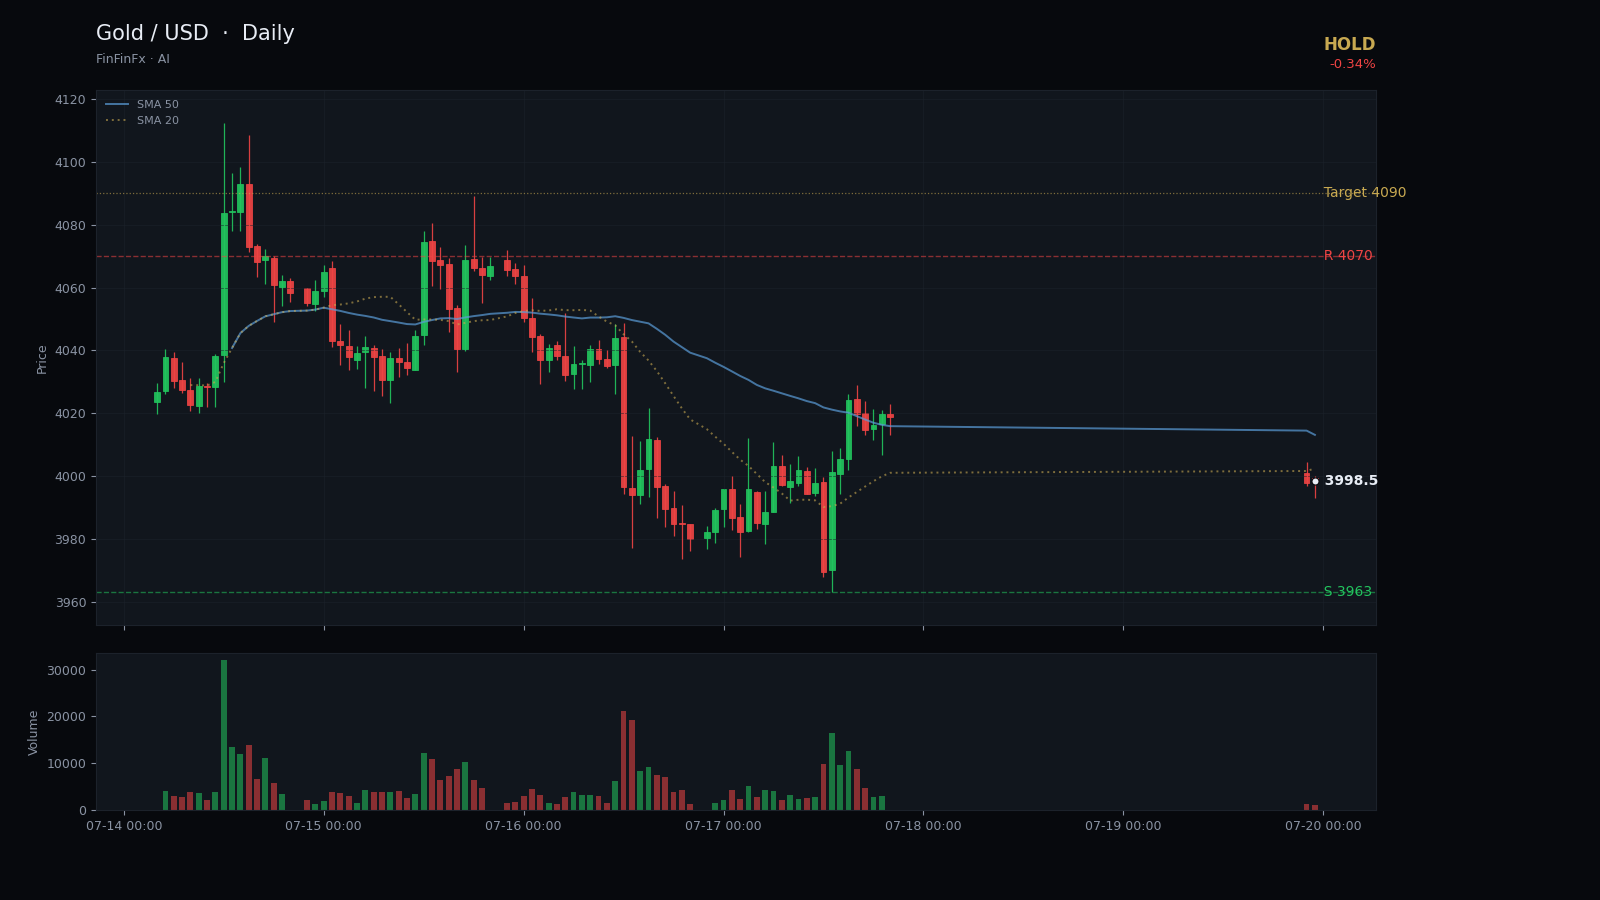
Trendline structure
Descending channel consolidation-
Resistance Jun 15 descending resistance
This resistance trendline connects the June 15 high at 4362 and the July 6 peak at 4199, defining the upper boundary of the descending channel.
Anchors: 2026-06-15 @ 4,362.00 → 2026-07-06 @ 4,199.70
-
Support Jun 24 channel support
This support trendline runs through the June 24 low at 3963 and the July 17 low at 3964, marking the lower boundary of the channel that price is currently testing.
Anchors: 2026-06-24 @ 3,963.30 → 2026-07-17 @ 3,964.20
Gold has been carving out a descending channel since mid-June, with price making lower highs and lower lows inside well-defined boundaries. The upper resistance line connects the 4362 peak on 15 June and the 4199 high on 6 July, while the lower support trendline runs through the 3963 low on 24 June and the recent 3964 low on 17 July. This channel structure has contained all meaningful price swings for nearly five weeks, and the current close at 3998.89 sits just above the lower boundary, suggesting the market is testing support once again.
The short-term moving averages confirm the downward bias: SMA5 at 4020 and SMA20 at 4067 both slope lower and remain above price, acting as dynamic resistance. The 20-day range of 3962.50 to 4216.39 underscores the compression, with price now in the bottom quartile of that range. RSI14 at 48 is neutral—neither oversold nor overbought—which means the market has room to move in either direction without immediate momentum extremes. ATR14 at 76 points reflects the elevated intraday volatility we have seen during this consolidation phase.
Key horizontal levels frame the immediate decision zone. Primary support rests at 3963, the multi-touch low that has held twice in the past month. A daily close below that level would signal a breakdown from the channel and open the door to further losses. On the upside, resistance at 4070 marks the recent intraday high and the lower edge of the SMA cluster; reclaiming that zone would be the first sign of a reversal attempt. The 20-day high at 4216 remains the broader resistance target, but that level is far removed from current price action.
Given the neutral RSI, the proximity to channel support, and the lack of a clear breakout signal, the prudent stance is to hold and wait for confirmation. A bullish entry would require a daily close above 4070 with expanding volume, targeting a move back toward 4090 and potentially the SMA20. A stop-loss below 3940 protects against a channel breakdown. Conversely, a decisive break below 3963 would invalidate the support thesis and likely accelerate selling pressure. Until one of these boundaries gives way, Gold remains range-bound within the descending channel consolidation, and patience is the higher-probability approach.
Trade Jun 24 channel support and more on a real account — open one in minutes.
Open an account