
Daily Analysis EUR / USD Daily Range-bound consolidation
EUR/USD Consolidates in Narrow Range – Await Directional Break
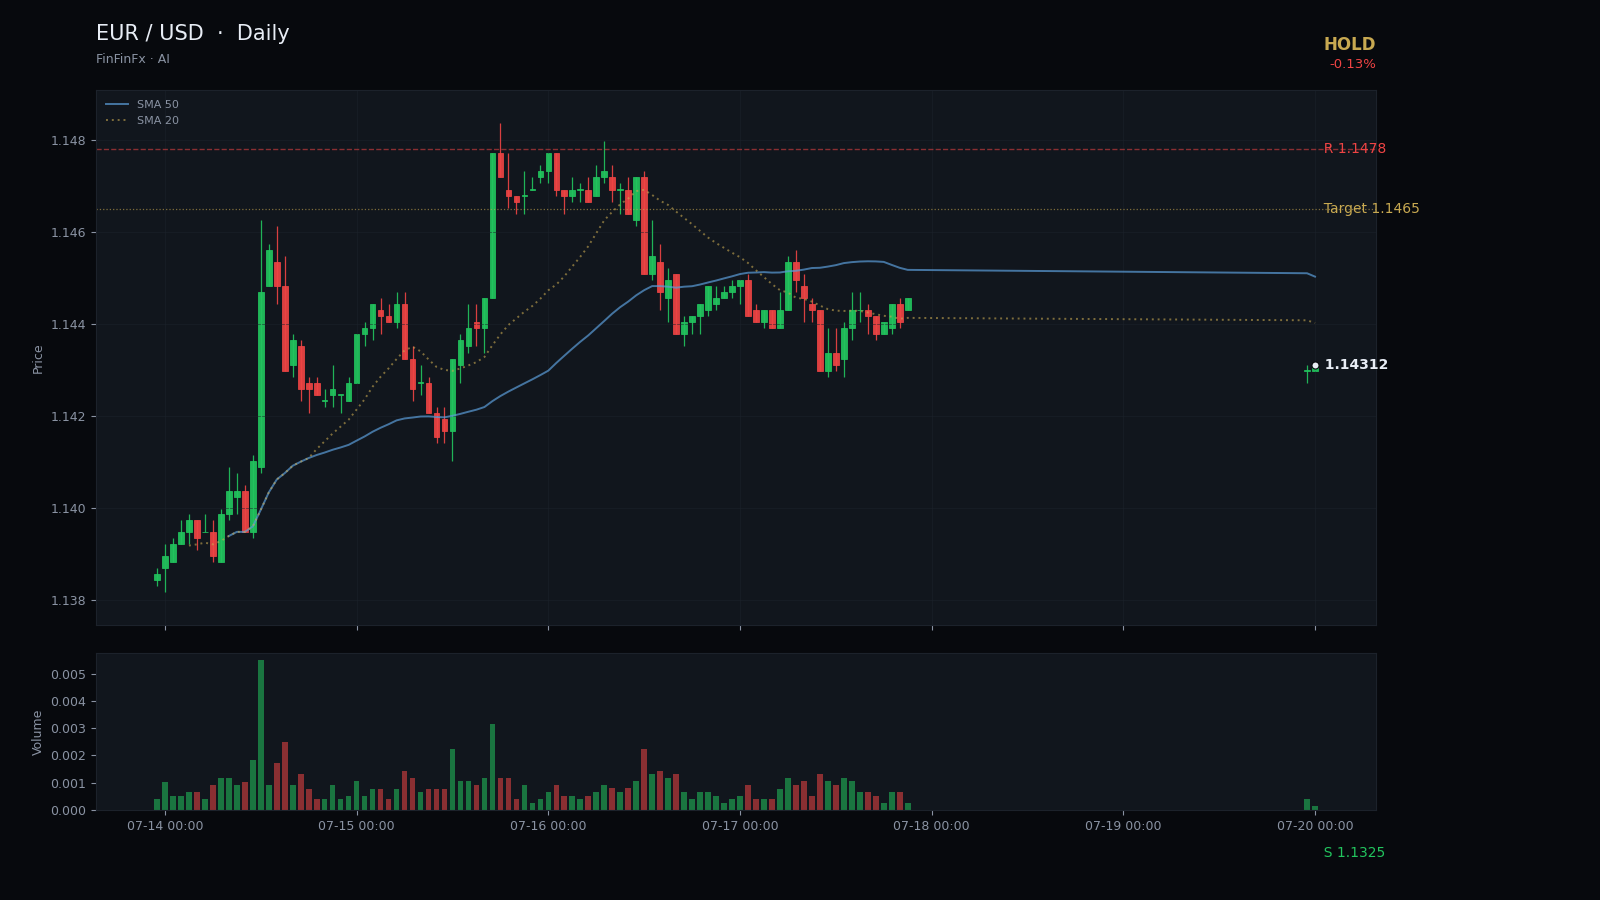
Trendline structure
Range-bound consolidation-
Support June 24 horizontal support
This horizontal support at 1.1325 marks the lowest point of the recent consolidation and has held firm through multiple tests.
Anchors: 2026-06-24 @ 1.1325 → 2026-06-25 @ 1.1334
-
Resistance Descending resistance line
This descending resistance connects the June 15 high with the July 16 swing high, capping rally attempts.
Anchors: 2026-06-15 @ 1.1623 → 2026-07-16 @ 1.1478
-
Support Rising support from June low
This gently rising support line from the June 24 low suggests gradual stabilisation and higher lows within the range.
Anchors: 2026-06-24 @ 1.1325 → 2026-07-20 @ 1.1419
EUR/USD has spent the past three weeks carving out a range-bound consolidation pattern between 1.1325 and 1.1478, with price action compressing steadily since the sharp decline from mid-June highs near 1.1622. The pair dropped nearly 300 pips between June 17 and June 24, then entered a stabilisation phase characterised by overlapping daily ranges and diminishing volatility. The 14-period ATR currently sits at 0.0055, reflecting this contraction in momentum, while the RSI14 at 51 signals neither overbought nor oversold conditions—classic hallmarks of indecision.
The most significant structural feature is the horizontal support zone anchored at 1.1325, established by the June 24 low and tested again on June 25. This floor has held firm through multiple intraday probes, suggesting institutional interest at that level. Above, resistance at 1.1478 marks the June 15 swing high and the upper boundary of the current range. Price has respected this ceiling on every rally attempt since late June, most recently on July 16 when the pair printed 1.1478 before reversing. The 5-day SMA at 1.1431 and 20-day SMA at 1.1412 are tightly clustered, further confirming the lack of directional conviction.
Given this structure, a hold stance is warranted until the market delivers a decisive breakout. A bullish scenario would require a daily close above 1.1478 on expanding volume, opening the door toward 1.1465 initially and potentially higher. Conversely, a breakdown below 1.1325 would shift the bias bearish, targeting the 1.1295 area. For traders seeking entry, waiting for a confirmed break and retest of either boundary offers better risk-reward than chasing price within the range. A stop-loss beneath 1.1295 protects against a deeper breakdown, while the target near 1.1465 assumes a successful upside breakout.
Invalidation of the hold thesis would come from a sharp move in either direction accompanied by a surge in ATR and RSI divergence. Until then, patience is the prudent approach as EUR/USD digests recent losses and builds energy for its next leg.
Trade Rising support from June low and more on a real account — open one in minutes.
Open an account