
Daily Analysis Oil / USD Daily Overbought relief rally
Oil Tests 82.76 Resistance After Sharp Rally, RSI Warns Overbought
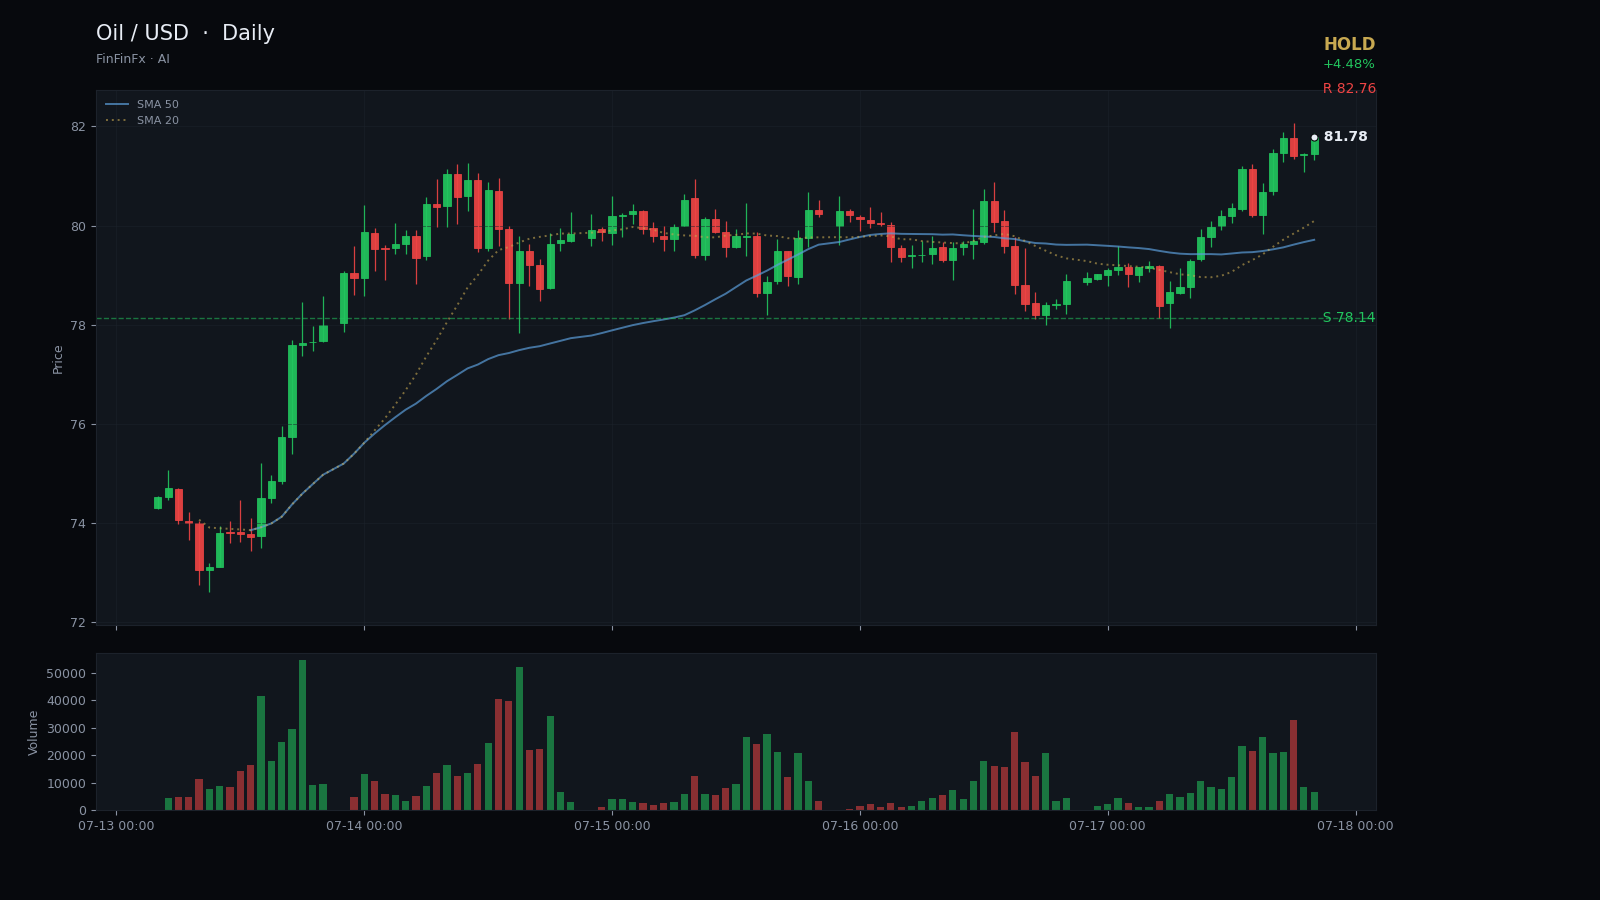
Trendline structure
Overbought relief rally-
Support July rising support
This trendline connects the July 2 low and July 10 swing low, defining the rally's lower boundary since early July.
Anchors: 2026-07-02 @ 67.0400 → 2026-07-10 @ 70.7700
Oil has staged a dramatic recovery from the late-June lows near 67.04, climbing more than 23% in three weeks to close at 82.49 on July 17. The most recent session alone delivered a 4.48% gain, pushing price to within 30 cents of the 20-day high at 82.76. This sharp ascent has unfolded along a well-defined rising support line that connects the July 2 low at 67.04 and the July 10 swing low at 70.77. Price has respected this trendline on every pullback since early July, confirming its relevance as the backbone of the current rally.
The five-day moving average at 79.70 now sits well above the 20-day average at 73.41, a classic sign of short-term momentum dominance. However, the 14-period RSI has surged to 78.33, deep into overbought territory and the highest reading in this dataset. While strong trends can sustain elevated RSI for days, such extremes often precede at least a pause or shallow retracement. The 14-day ATR of 3.23 suggests that daily swings of three to four dollars remain normal, so a pullback from current levels would not be unusual.
Immediate resistance sits at the 20-day high of 82.76, tested but not yet cleared in the most recent bar. A decisive break above that level would open the door toward 85.50, a measured extension based on the depth of the prior decline. On the downside, the July 13 breakout pivot at 78.14 now serves as primary support; a close below that zone would signal profit-taking and potentially invite a deeper correction toward the rising trendline near 76. The overbought relief rally pattern suggests that while the trend remains constructive, new long entries at current levels carry elevated risk. A more prudent approach is to hold existing positions with a stop below 76.05—the June 16 swing low—and wait for either a breakout above 82.76 or a pullback to support before adding exposure.
Invalidation of the bullish structure would require a daily close beneath 76.05, which would break both the rising trendline and the recent higher-low sequence. Until that occurs, the path of least resistance remains upward, but the pace of gains may slow as the market digests the recent surge.
Trade July rising support and more on a real account — open one in minutes.
Open an account