
Daily Analysis EUR / USD Daily Consolidation after sharp decline
EUR/USD Consolidates Near 1.1446 After June Selloff, Awaiting Directional Clarity
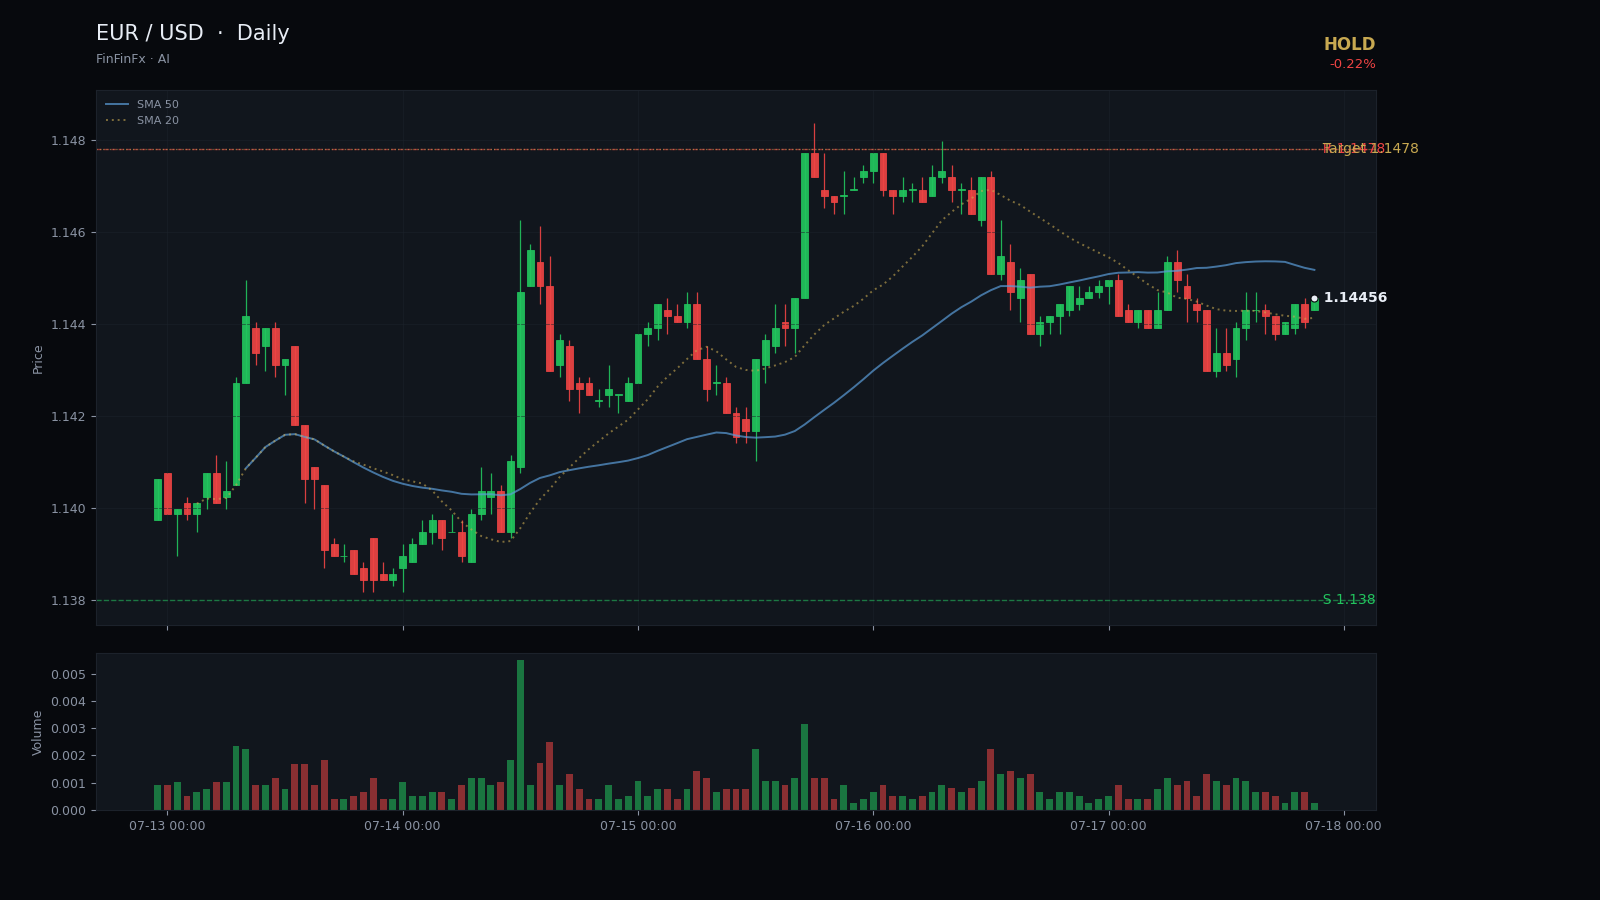
Trendline structure
Consolidation after sharp decline-
Support Rising support from June low
This ascending trendline connects the June 25 and July 14 lows, showing buyers defending progressively higher levels and preventing a retest of the 1.1325 floor.
Anchors: 2026-06-25 @ 1.1354 → 2026-07-14 @ 1.1384
-
Resistance Horizontal resistance ceiling
The 1.1478 level has capped three rally attempts since late June, forming a clear horizontal resistance that defines the upper boundary of the current consolidation range.
Anchors: 2026-06-30 @ 1.1434 → 2026-07-16 @ 1.1478
EUR/USD has spent the past four weeks consolidating inside a well-defined range after a sharp decline from mid-June highs near 1.1622. The pair dropped nearly 300 pips between June 17 and June 25, carving out a clear downtrend that found its floor at 1.1325. Since late June, price has stabilised between 1.1380 support and 1.1478 resistance, forming a horizontal consolidation pattern that reflects indecision rather than conviction.
The rising support trendline connecting the June 25 low at 1.1354 and the July 14 low at 1.1379 shows that buyers have been willing to step in at progressively higher levels, preventing a retest of the June lows. This line currently projects near 1.1400, offering dynamic support beneath the current close of 1.1446. Meanwhile, the 20-day high at 1.1478 has capped three separate rally attempts since late June, establishing a firm resistance ceiling. Price is now trading just below this level, with the SMA5 at 1.1426 sitting below the SMA20 at 1.1414—a configuration that suggests short-term momentum is neutral to slightly positive but lacks the strength to confirm a breakout.
The RSI14 reading of 58 sits comfortably in the middle zone, neither overbought nor oversold, while the ATR14 of 0.0056 indicates that daily volatility has compressed relative to the June selloff. This contraction often precedes a directional move, but the current price action offers no clear signal. A decisive close above 1.1478 would open the door to a retest of the 1.1550–1.1580 zone, while a breakdown below 1.1380 would shift the bias back to the downside and target the June low near 1.1325.
Given the lack of directional clarity, the prudent stance is to hold and wait for confirmation. Entry at 1.1446 is reasonable for traders already positioned, with a stop-loss below 1.1350 to protect against a resumption of the June downtrend. The initial target sits at 1.1478 resistance; only a sustained break above that level would justify raising targets toward 1.1550. The setup is invalidated if price closes below 1.1350, signalling that sellers have regained control and the consolidation was merely a pause in the broader decline.
Trade Horizontal resistance ceiling and more on a real account — open one in minutes.
Open an account