
Daily Analysis Bitcoin / USD Daily Consolidation near resistance
Bitcoin Consolidates Below 65K Resistance After Recent Rally Attempt
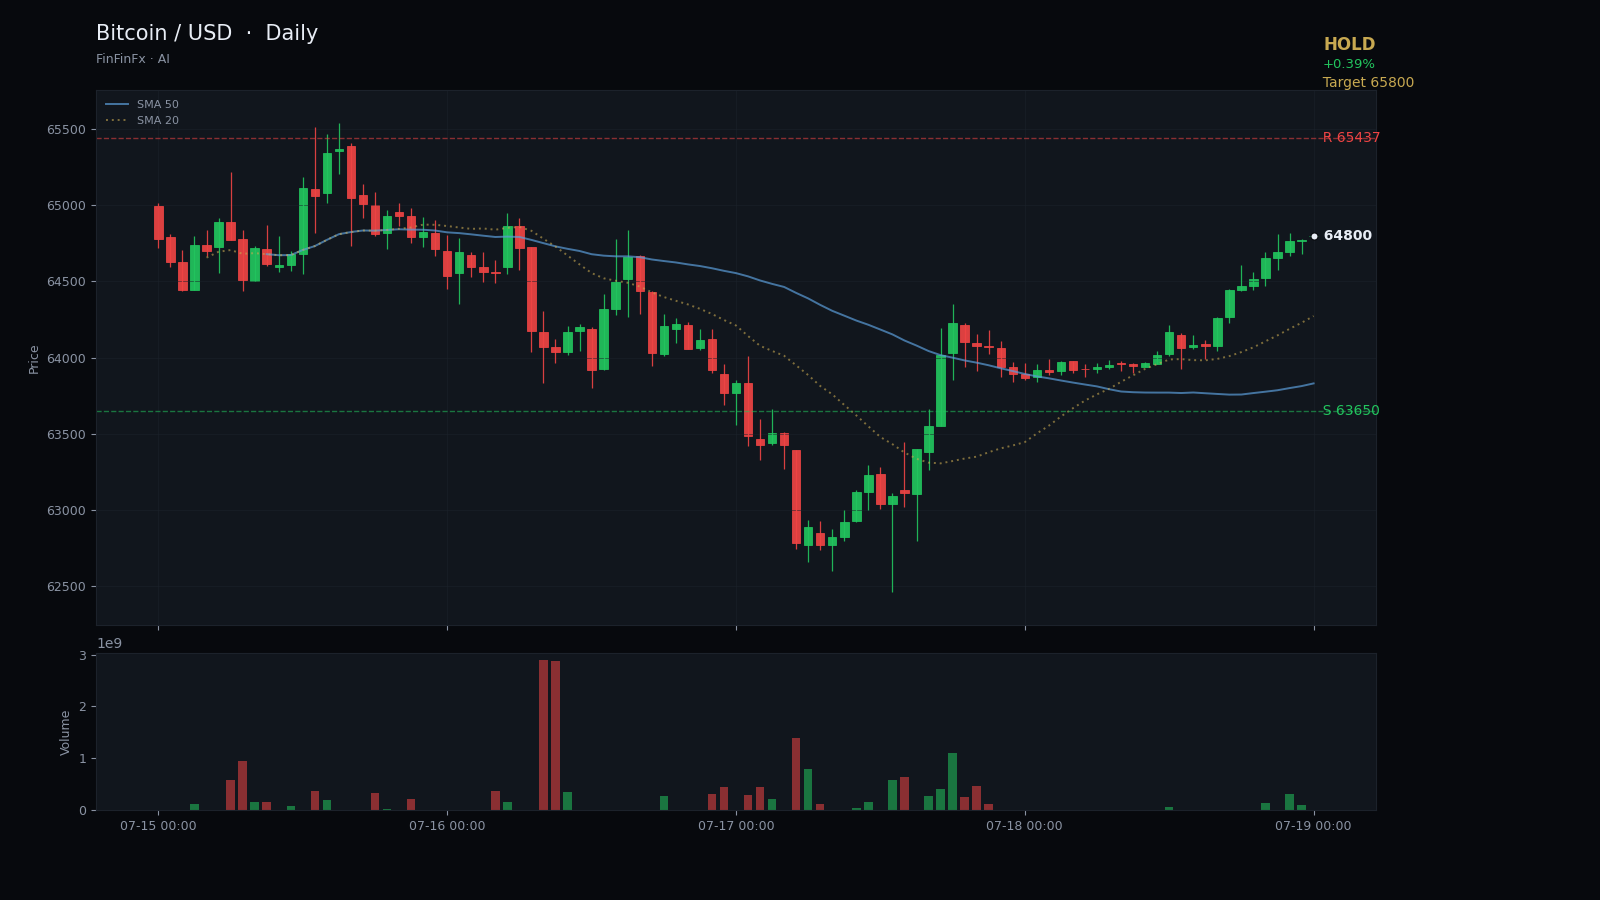
Trendline structure
Consolidation near resistance-
Support Rising support from July lows
This trendline connects the July 1 and July 8 swing lows, defining the lower boundary of the recovery channel and currently projecting support near 63,200.
Anchors: 2026-07-01 @ 57,945.00 → 2026-07-08 @ 61,550.00
-
Resistance Resistance zone near 65K
Price has tested the 65,400 area twice in recent sessions without achieving a sustained breakout, marking this as the key overhead barrier.
Anchors: 2026-07-15 @ 65,437.00 → 2026-07-19 @ 64,798.00
Bitcoin has established a rising support trendline connecting the lows of July 1 at 57,945 and July 8 at 61,550, defining the lower boundary of a recovery channel that has guided price action for nearly three weeks. This trendline currently projects support near 63,200, and price has respected this structure through multiple tests during the consolidation phase. The upward slope reflects the market's ability to absorb selling pressure at progressively higher levels, though momentum has visibly slowed as price approaches overhead resistance.
The 20-day high at 65,437, printed on July 15, now serves as the immediate resistance ceiling. Price tested this zone again on July 19, reaching 64,798 before closing at 64,773, just 0.39% above the prior session. This hesitation near resistance, combined with an RSI14 reading of 59.4, suggests the market is neither overbought nor oversold but rather in a neutral holding pattern. The SMA5 at 64,507 sits just below current price, while the SMA20 at 63,136 confirms the intermediate uptrend remains intact. ATR14 of 1,523 points indicates volatility has compressed relative to the sharp swings seen in late June, when daily ranges exceeded 3,000 points.
The consolidation near resistance pattern describes the current structure: price has recovered from the 57,945 low but now pauses beneath the 65,437 ceiling, digesting recent gains without committing to a breakout or reversal. A hold signal at 64,773 reflects this indecision. Traders watching for a long entry might wait for a daily close above 65,500 with expanding volume, targeting the psychological 66,000 level and potentially 65,800 as an interim objective. Support lies at 63,650, aligning with recent consolidation lows, with the rising trendline providing secondary support near 63,200.
Risk parameters are straightforward: a break below 63,200 would violate the rising support trendline and likely trigger a retest of the 62,000–61,500 zone, invalidating the near-term bullish structure. Until price resolves this consolidation—either through a decisive breakout above 65,437 or a breakdown below 63,650—patience is warranted. The technical setup favours neither bulls nor bears with conviction, and premature positioning carries elevated risk in a range-bound environment.
Trade Resistance zone near 65K and more on a real account — open one in minutes.
Open an account