
Daily Analysis Gold / USD Daily Descending channel consolidation
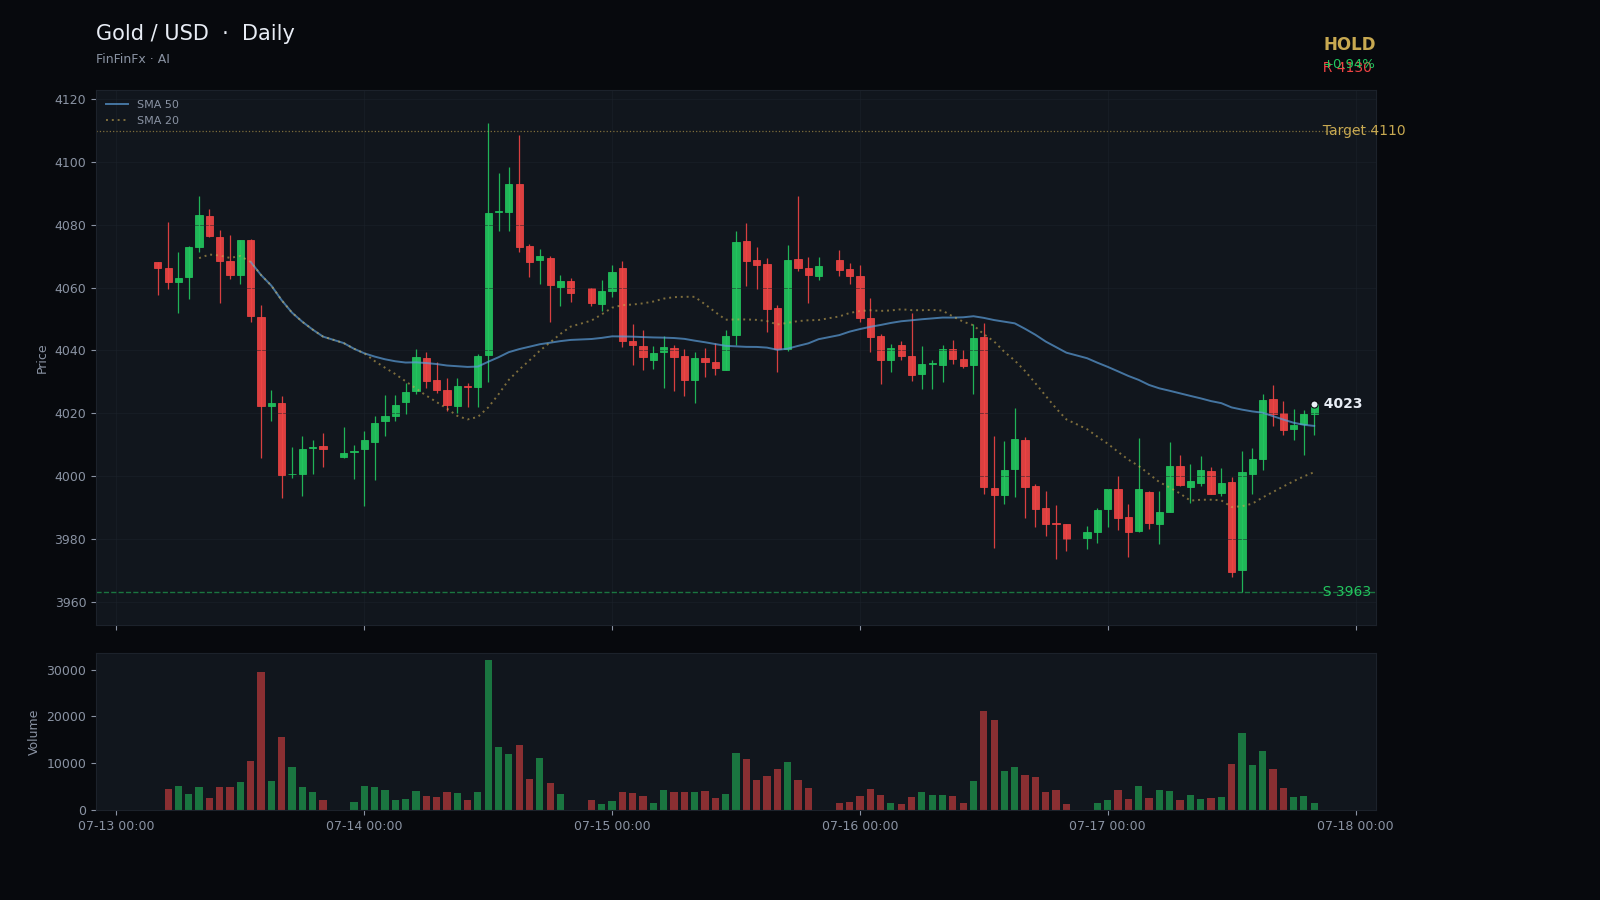
Gold Consolidates Below SMA20 in Descending Channel Near 4023
Trendline structure
Descending channel consolidation-
Resistance June descending resistance
This trendline connects the June 4 high at 4509 and the July 6 peak at 4199, capping all rally attempts within the descending channel.
Anchors: 2026-06-04 @ 4,509.90 → 2026-07-06 @ 4,199.70
-
Support Parallel channel support
Drawn from the June 10 low at 4100 through the June 30 trough at 3962, this line defines the lower boundary of the descending channel.
Anchors: 2026-06-10 @ 4,100.00 → 2026-06-30 @ 3,962.50
Gold has been trading within a descending channel since early June, defined by a resistance trendline connecting the 4509 high on June 4 and the 4199 peak on July 6. This upper boundary has capped every rally attempt over the past six weeks, most recently rejecting price near 4130 on July 9. The parallel support line, drawn from the June 10 low at 4100 through the June 30 trough at 3962, has provided a floor during sell-offs. The channel is now five weeks old and price remains compressed within it, signaling indecision rather than directional conviction.
The last close at 4023 sits just below the SMA5 at 4022 and well beneath the SMA20 at 4079, confirming that the short-term trend remains soft. The RSI14 reading of 45.67 is neutral—neither oversold nor overbought—while the ATR14 of 81 points reflects elevated intraday volatility. Immediate resistance is marked by the recent swing high at 4130, which aligns with the upper channel boundary. On the downside, support rests at 3963, the 20-day low and the lower channel edge, with the psychological 4000 level acting as an intermediate buffer.
Given the descending channel consolidation and the lack of a clear breakout signal, a hold stance is appropriate. Traders already positioned long might consider tightening stops below 3940 to protect against a breakdown. A sustained close above 4130 would suggest channel exhaustion and open the door to a test of the SMA20 near 4079 and potentially 4200. Conversely, a daily close below 3963 would invalidate the current structure and likely accelerate selling toward 3900 or lower. Until price commits to a direction, patience is warranted.
The descending channel pattern reflects a controlled correction rather than panic selling, but the failure to reclaim the SMA20 keeps the near-term bias cautious. Watch for volume expansion and a decisive break of either channel boundary before committing fresh capital. Risk management remains paramount in this environment of elevated volatility and compressed price action.
Trade Parallel channel support and more on a real account — open one in minutes.
Open an account