
Daily Analysis EUR / USD Daily Consolidation after sharp decline
EUR/USD Consolidates Near Mid-Range After June Selloff, Awaiting Directional Catalyst
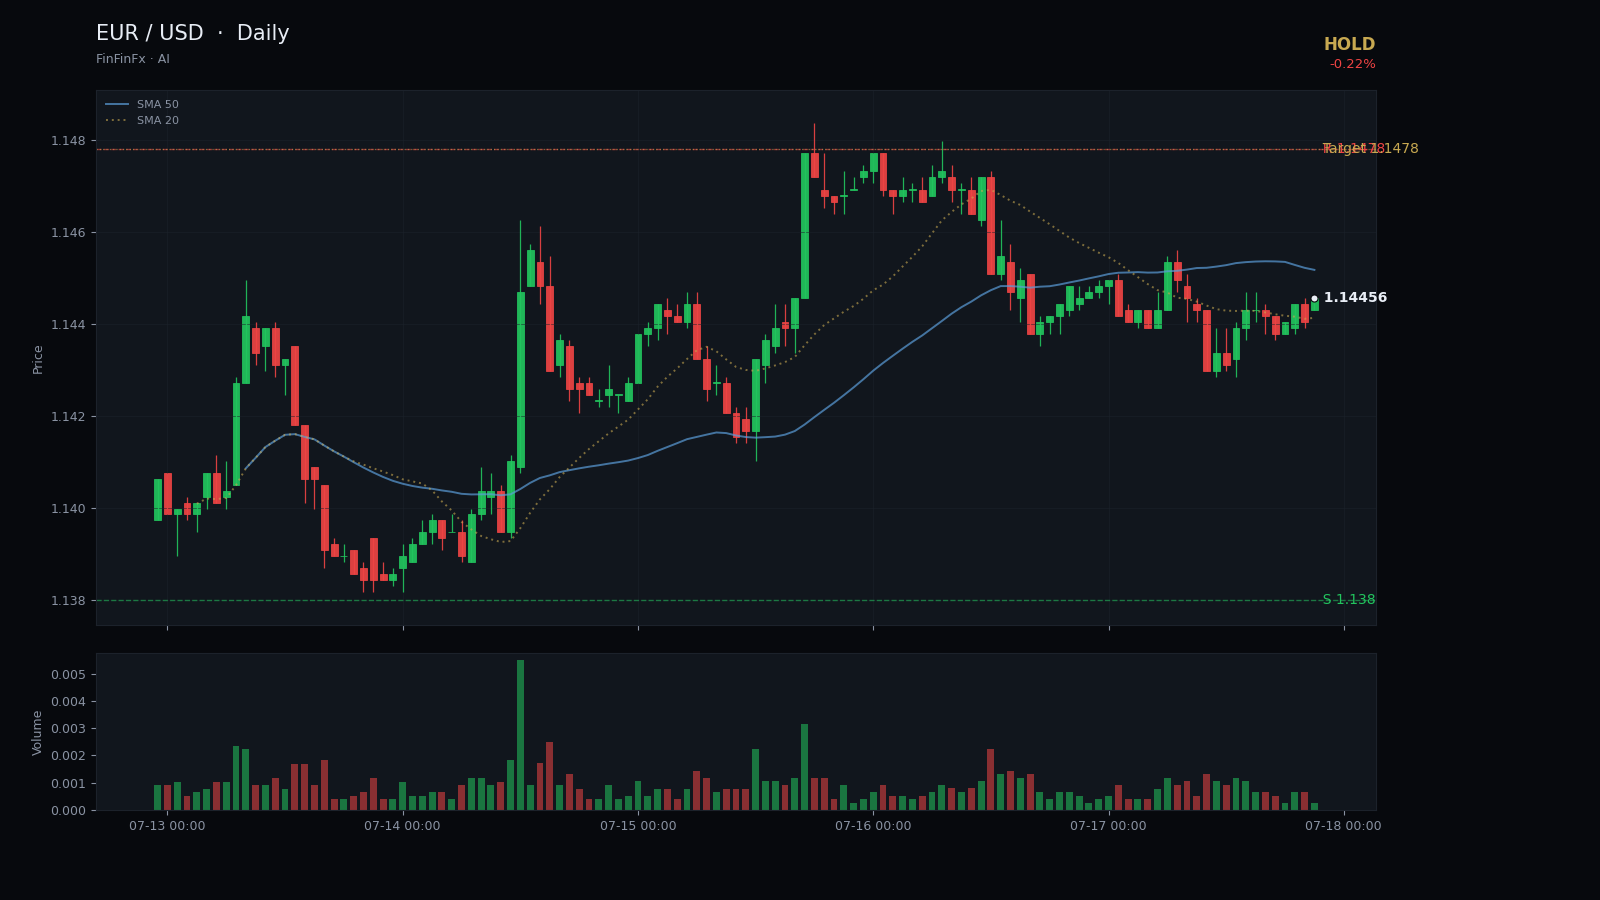
Trendline structure
Consolidation after sharp decline-
Support Rising support from June low
This ascending trendline connects the 24 June low and the 14 July low, defining the lower boundary of the current consolidation and has been respected on multiple tests.
Anchors: 2026-06-24 @ 1.1325 → 2026-07-14 @ 1.1379
-
Resistance Descending resistance from June peak
This declining trendline connects the 15 June peak and the 16 July high, capping rallies and defining the upper boundary of the post-selloff range.
Anchors: 2026-06-15 @ 1.1623 → 2026-07-16 @ 1.1478
EUR/USD has spent the past three weeks oscillating inside a well-defined range after a sharp decline from the 1.1622 peak on 15 June to a 1.1325 low on 24 June. The pair currently trades at 1.1446, roughly mid-range, with the 20-day high at 1.1478 capping upside and a rising support trendline connecting the 24 June and 14 July lows providing a floor near 1.1380. This rising support line—anchored at 1.1325 and 1.1384—has been respected on three separate tests over the past two weeks, suggesting buyers remain willing to defend the lower boundary of this consolidation zone.
The five-day moving average at 1.1426 has crossed above the twenty-day at 1.1414, a minor bullish signal, yet price has failed to sustain momentum above the 1.1478 resistance. RSI sits at 58, neither overbought nor oversold, and ATR at 0.0056 reflects subdued volatility typical of range-bound trade. The pattern here is consolidation after a sharp decline: the market is digesting the June selloff without committing to a new directional leg. Horizontal resistance at 1.1478 aligns with the 16 July high, while support clusters around 1.1380, where the rising trendline and recent swing lows converge.
Given the lack of a clear breakout and the neutral momentum profile, the prudent stance is to hold and wait for a decisive move. A break and daily close above 1.1478 would open the door toward 1.1520–1.1550, while a violation of 1.1380 support would likely accelerate selling toward 1.1325 and potentially lower. For traders already positioned, a stop below 1.1350 protects against a breakdown, with an initial target at the range high of 1.1478. Until one of these boundaries gives way, EUR/USD remains trapped in a consolidation pattern, and patience is warranted. The call is invalidated if price closes below the rising support trendline at 1.1380 or if a daily close above 1.1478 triggers a sustained breakout.
Trade Descending resistance from June peak and more on a real account — open one in minutes.
Open an account