
Daily Analysis Oil / USD Daily Ascending channel breakout attempt
Oil Tests Upper Channel Resistance After Sharp Recovery From June Lows
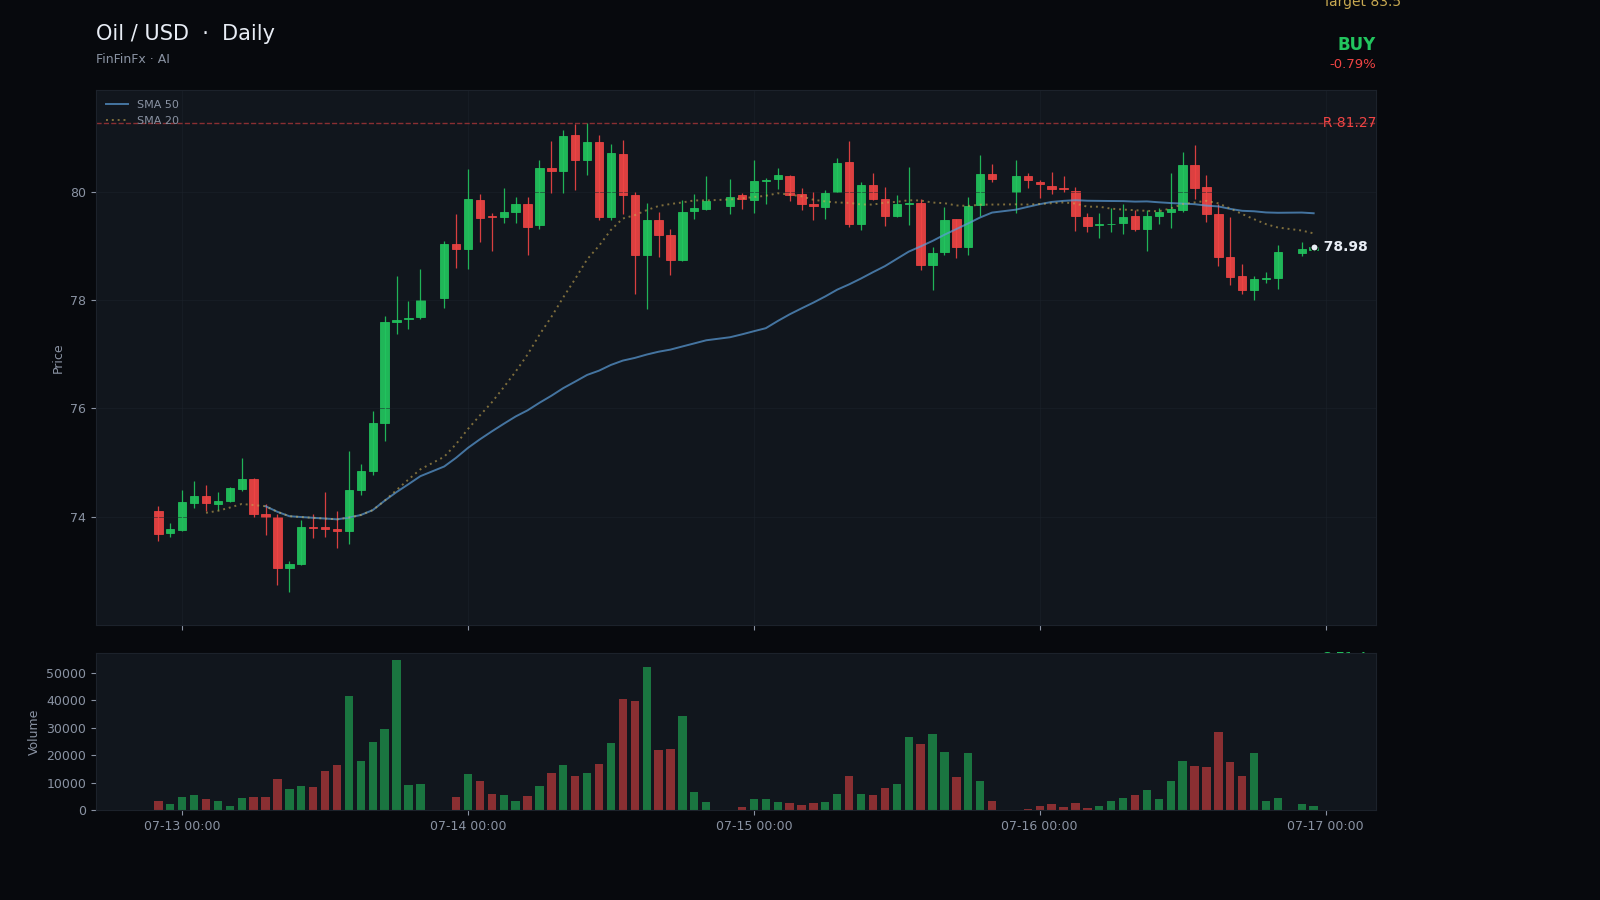
Trendline structure
Ascending channel breakout attempt-
Support Rising channel support
This ascending support line connects the June 30 and July 10 lows, defining the lower boundary of the three-week recovery channel.
Anchors: 2026-06-30 @ 69.5000 → 2026-07-10 @ 71.4100
-
Resistance Descending channel resistance
This resistance line drawn from the June 8 high through the July 14 peak forms the upper boundary of the current channel structure.
Anchors: 2026-06-08 @ 95.4700 → 2026-07-14 @ 81.2700
USOIL has carved out a well-defined ascending channel over the past three weeks, anchored by a rising support line that connects the June 30 low at 69.50 and the July 10 swing low at 71.41. Price has respected this support twice, most recently on July 10, before launching a powerful rally that added more than 10% in just four sessions. The upper boundary of this channel, drawn from the June 8 high at 95.47 through the July 14 peak at 81.27, now sits directly overhead and has capped the most recent advance.
The structure tells a story of controlled accumulation after a brutal selloff from mid-90s in early June down to a 67.04 low on July 2. Since that capitulation, buyers have stepped in at progressively higher lows, building a staircase of support that has lifted price back above both the 5-day SMA at 77.49 and the 20-day SMA at 73.12. The 20-day range spans from 67.04 to 81.27, and current price at 78.97 sits in the upper third of that range, suggesting the bulls have regained control of the intermediate-term trend.
Key horizontal resistance lies at 81.27, the July 14 high and the 20-day ceiling. A decisive break and hold above this level would confirm the ascending channel breakout attempt and open the door to a measured move toward 83.50, derived from the channel width projected upward. Primary support rests at 71.40, the July 10 swing low and the most recent test of the rising trendline. The RSI at 65.6 shows healthy momentum without overbought extremes, while the ATR of 3.07 reflects elevated but manageable volatility.
The tactical call is to buy at current levels near 78.97, targeting 83.50 on a breakout above 81.27, with a stop-loss placed below 70.50 to protect against a breakdown of the channel structure. Risk is defined by a failure to hold the rising support line; a daily close beneath 71.40 would signal that the recovery is stalling and warrant an exit. Until that occurs, the path of least resistance remains higher within this ascending channel framework.
Trade Descending channel resistance and more on a real account — open one in minutes.
Open an account